Monitoring for Migrations
The Monitoring Dashboards for Migrations helps capture system insights for various components of the migration such as dataflow, datastream, spanner, etc. The dashboard can be used as a tool for logging and diagnostics. For each of these components using measures such as CPU utilization, storage, throughput and more you can track the health and status of your migration. It also helps identify if anything is not working as expected and if any of the components need to be scaled up or down. Spanner Migration Tool uses the Google Cloud Monitoring Service to create custom dashboard for each migration.
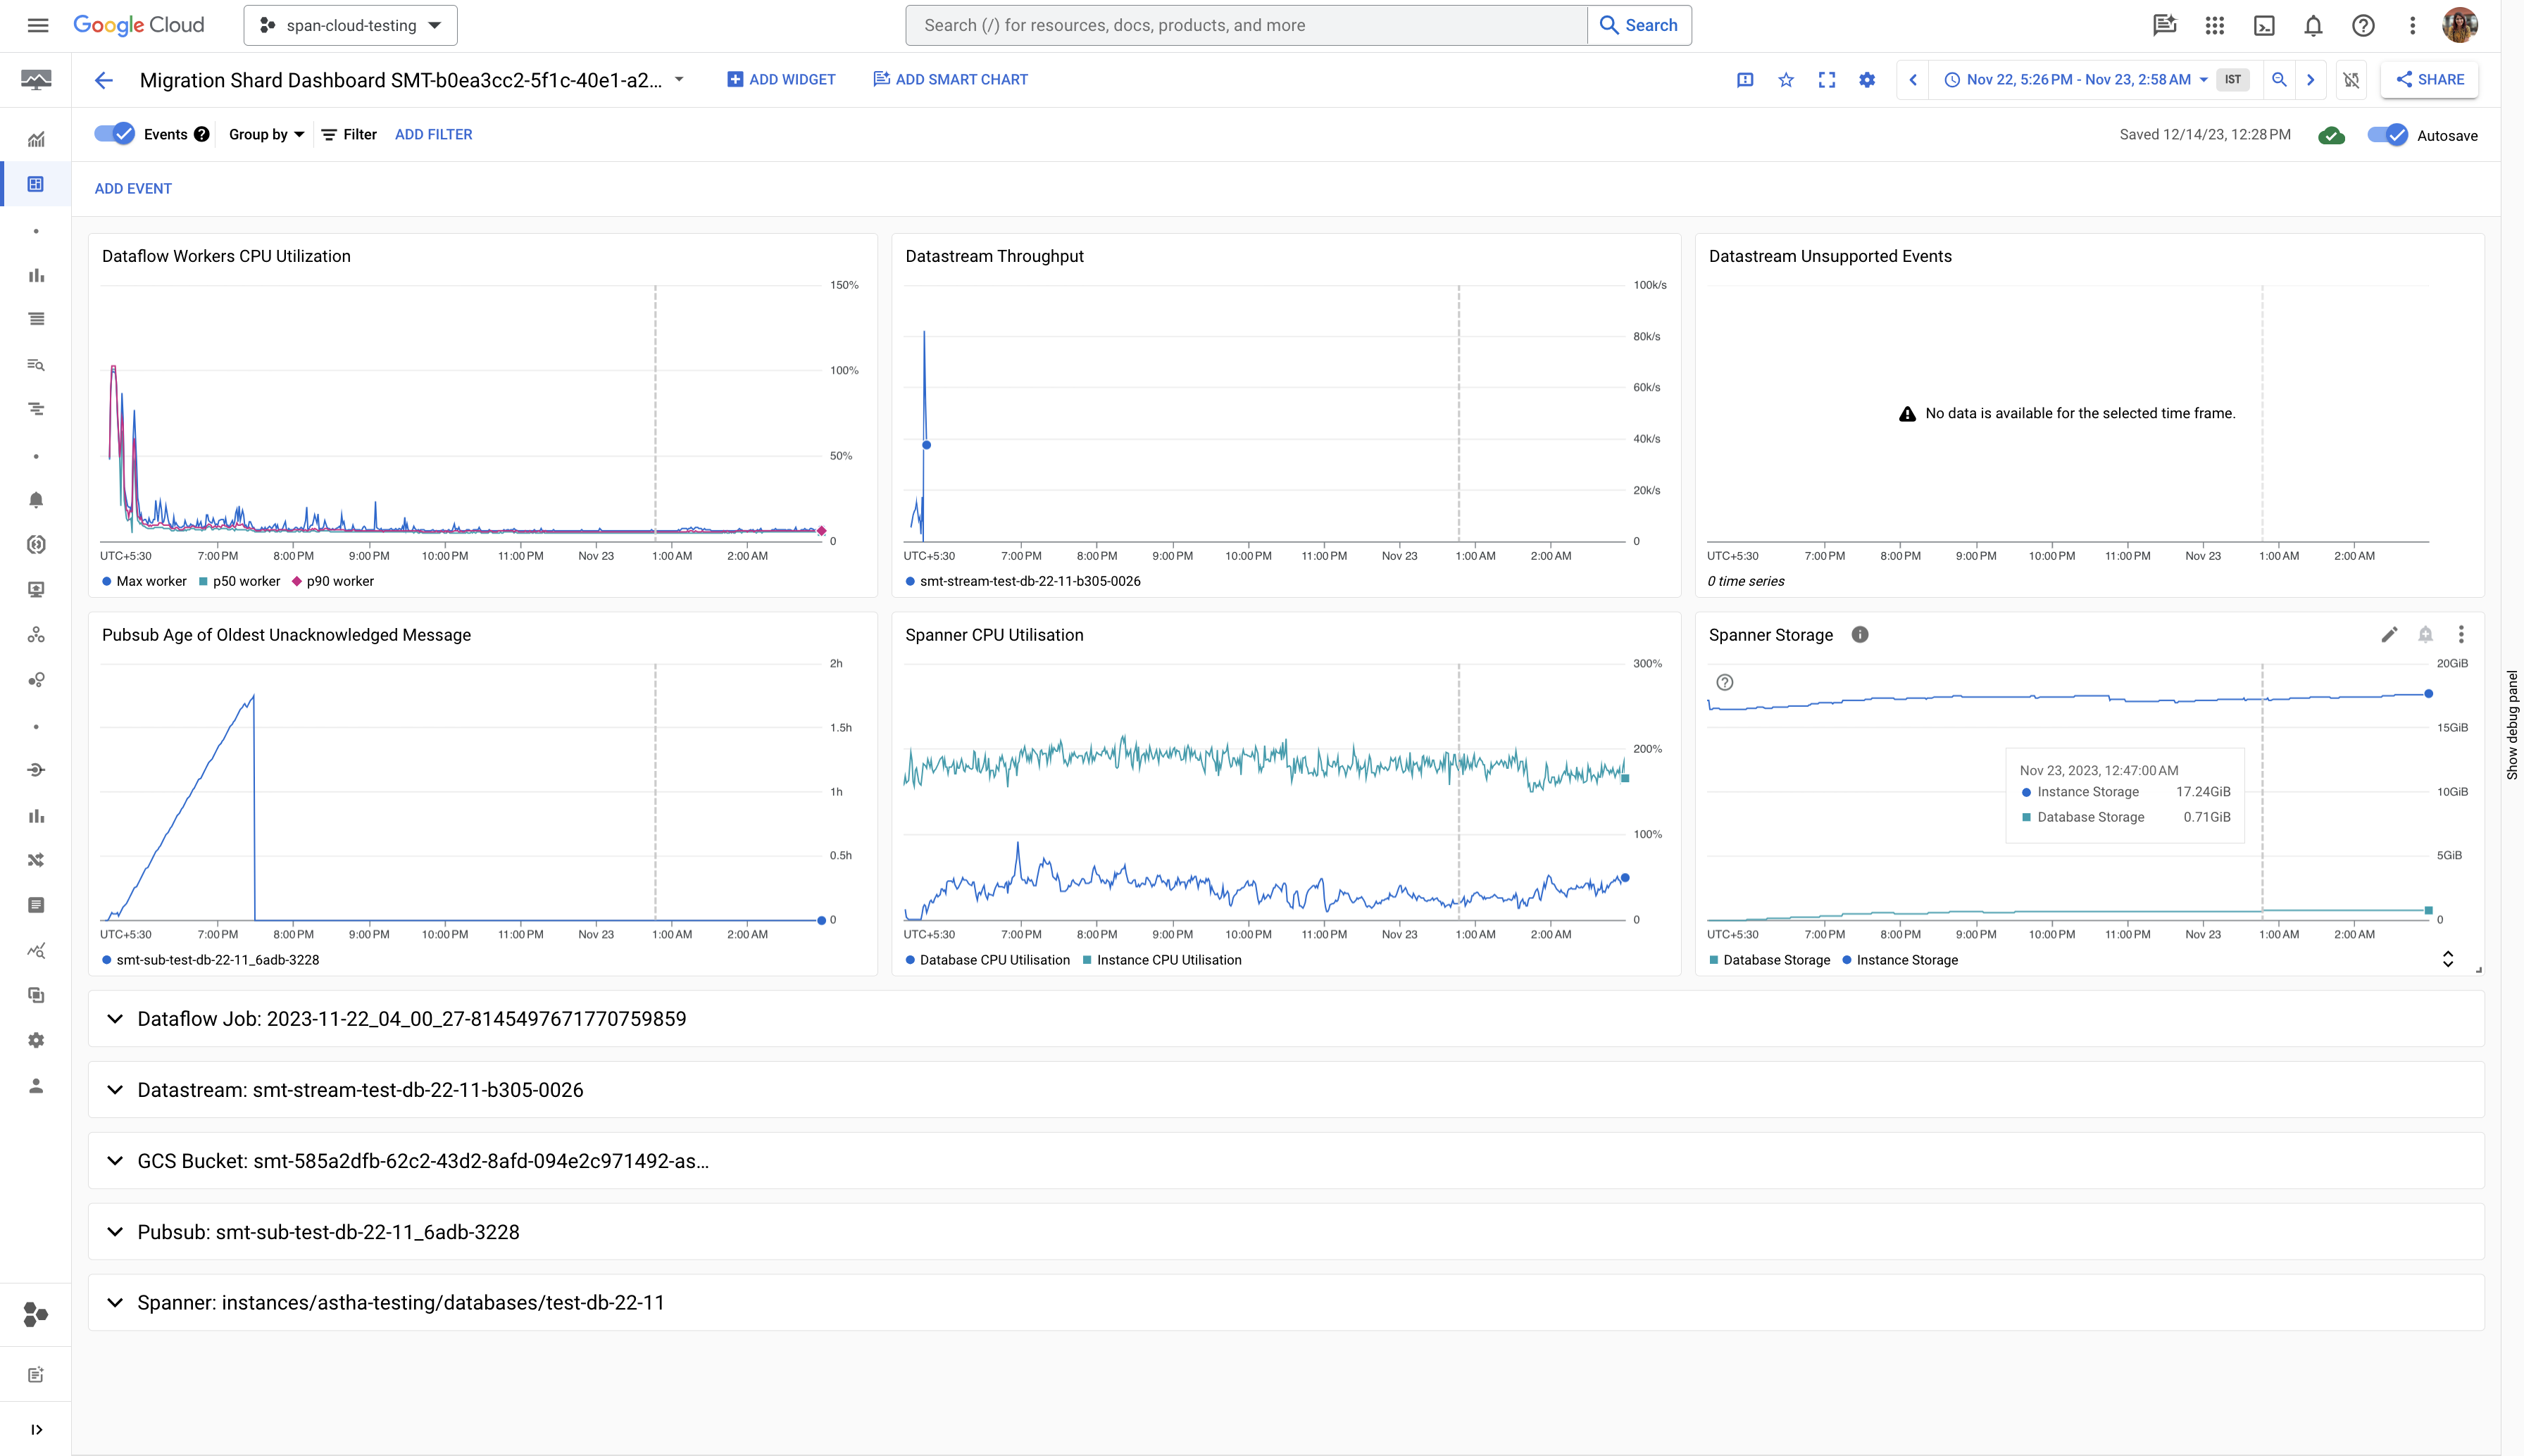
Each monitoring dashboard contains the following features as seen in the screenshot provided:
- Top level metrics for an overview of overall health and progress of migration.
- Five sections for Dataflow, Datastream, GCS Bucket, Pubsub and Spanner for in-depth analysis of each component.
- Time range filter to filter the statistics by time ranges, such as hours, days, or a custom range.
- For sharded migrations, monitoring dashboards for each shard and an aggregated dashboard for overall monitoring.
Where is my Dashboard?
UI
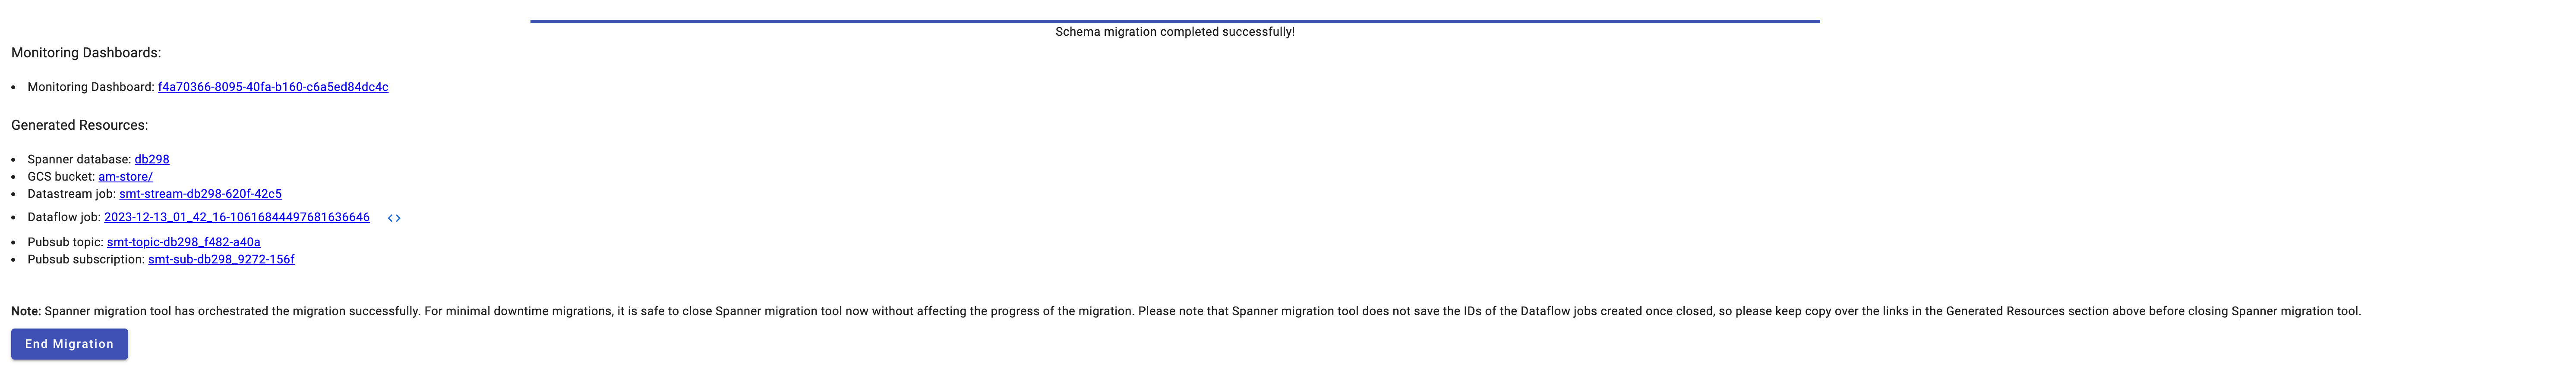
The Monitoring Dashboard link can be found under the Monitoring Dashboards section on the Prepare Migration page after all the resources have been generated. If the dashboard is not visible please check the terminal for any errors in dashboard creation and make sure the correct permissions are provided.
CLI
The unique name for the dashboard will be printed on the console. This dashboards can be accessed through cloud monitoring custom dashboards page.

Console
To find your monitoring following the below steps:
-
Open the Cloud Console page for your project and search for Monitoring Dashboards

- Select the Dashboards under Monitoring section
-
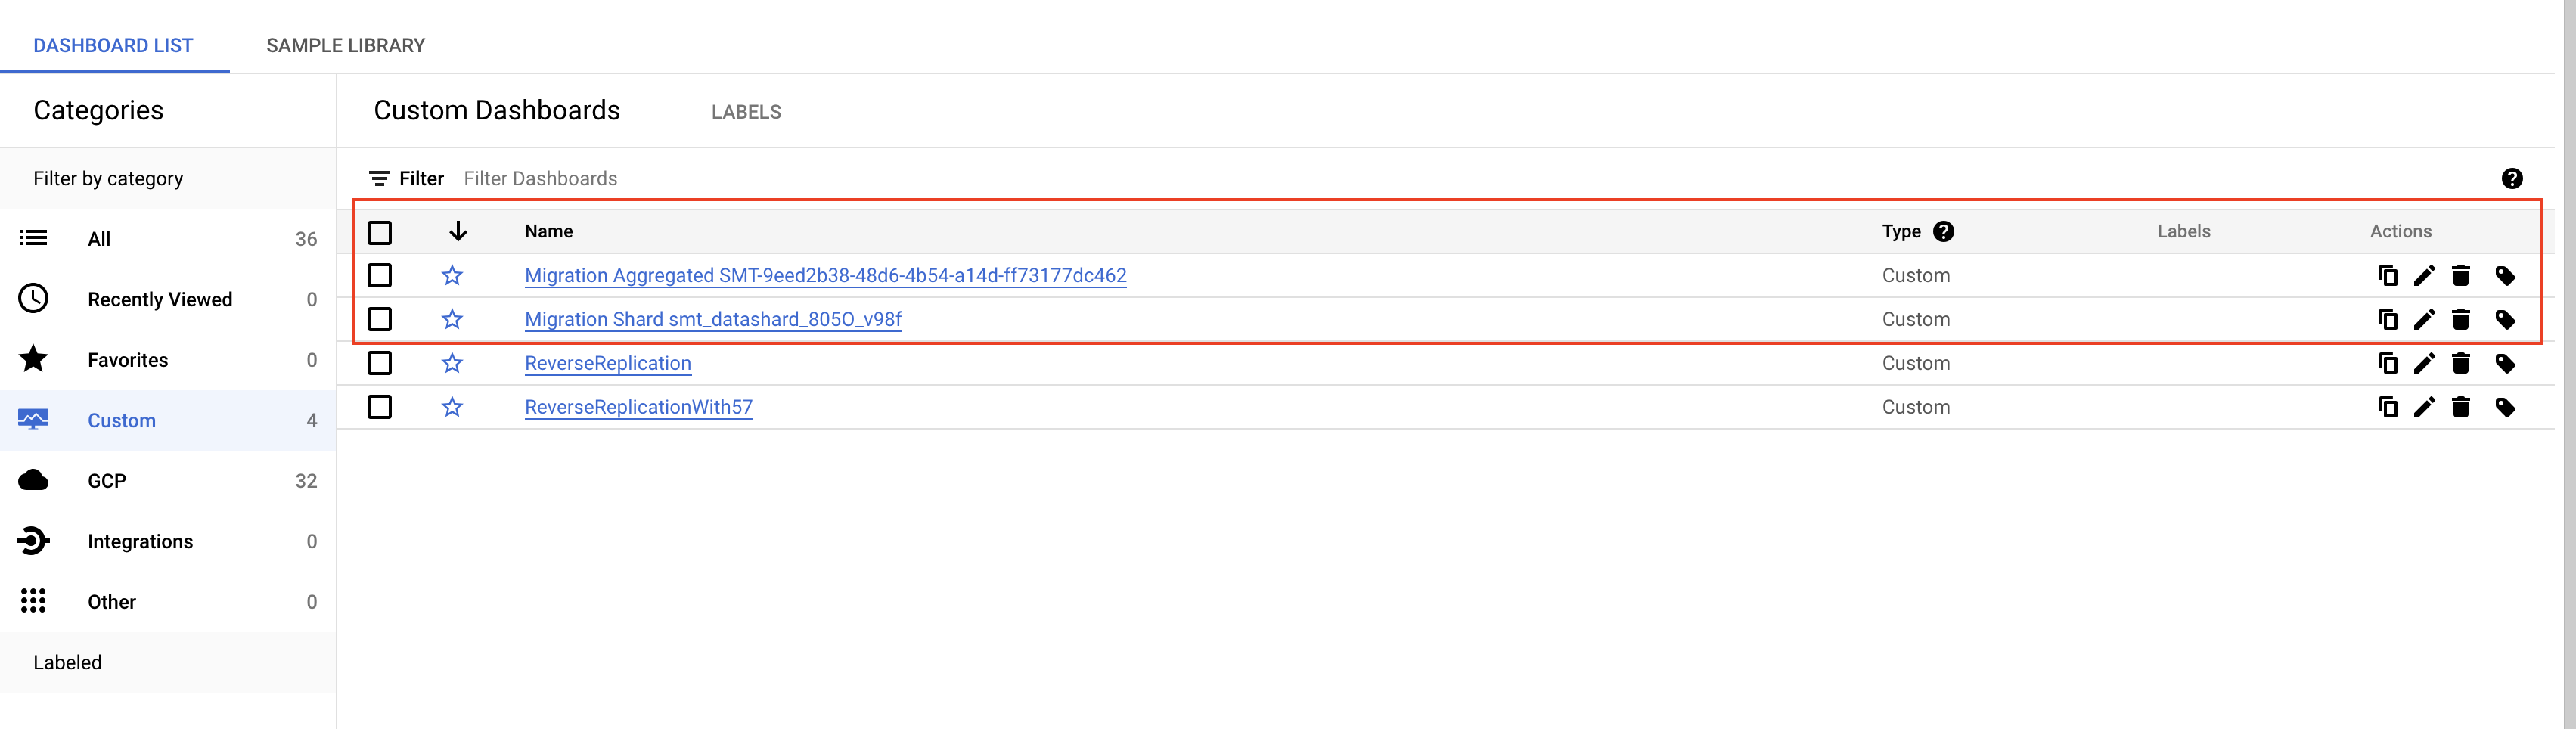
Select Custom Dashboards
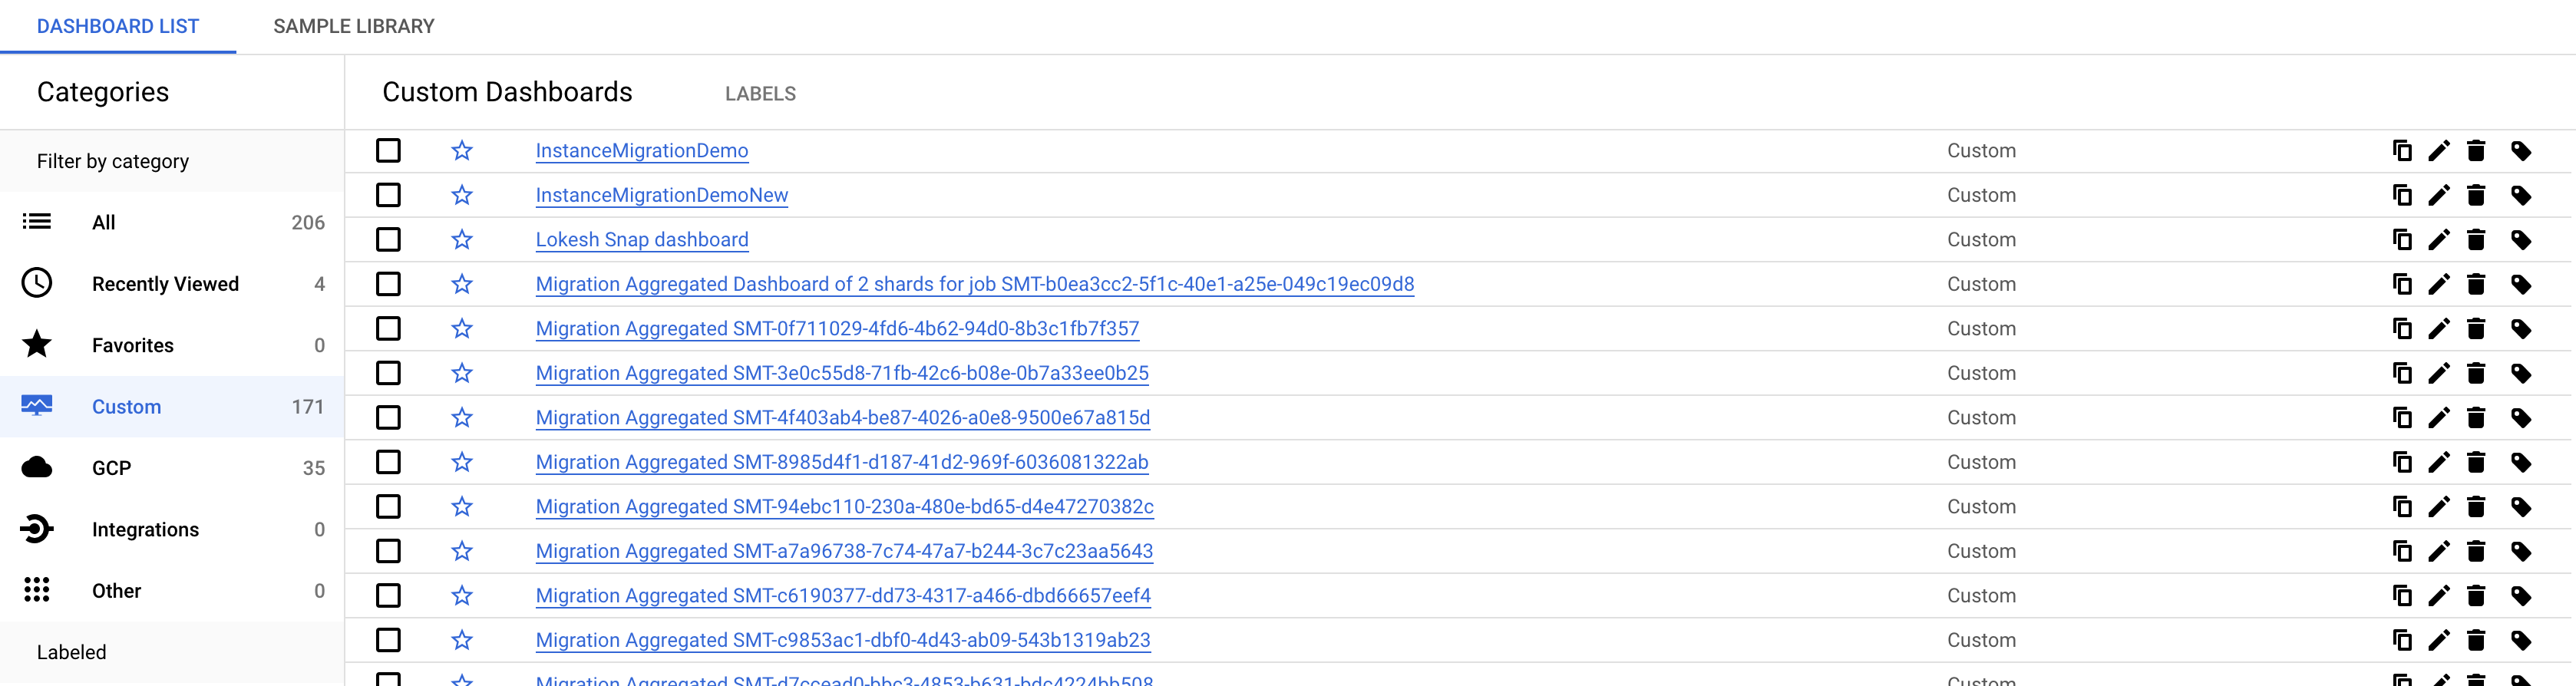
- Search for your dashboard based on the Migration ID or Shard ID.
For further details on metrics in the Monitoring Dashboard refer to the links below: