Migration Monitoring Dashboard
The Migration Monitoring Dashboard is a custom dashboard created to provide greater visibility into the health and progress of various components of the migration.
Table of contents
Components in Monitoring Dashboard
Monitoring dashboard create by the Spanner is multi-component dashboard, divided into various sections to categorize similar metrics together. Following are the 5 sections:
- Overview
- Dataflow
- Datastream
- GCS Bucket
- Pubsub
- Spanner
Below sections describe each component in more detail.
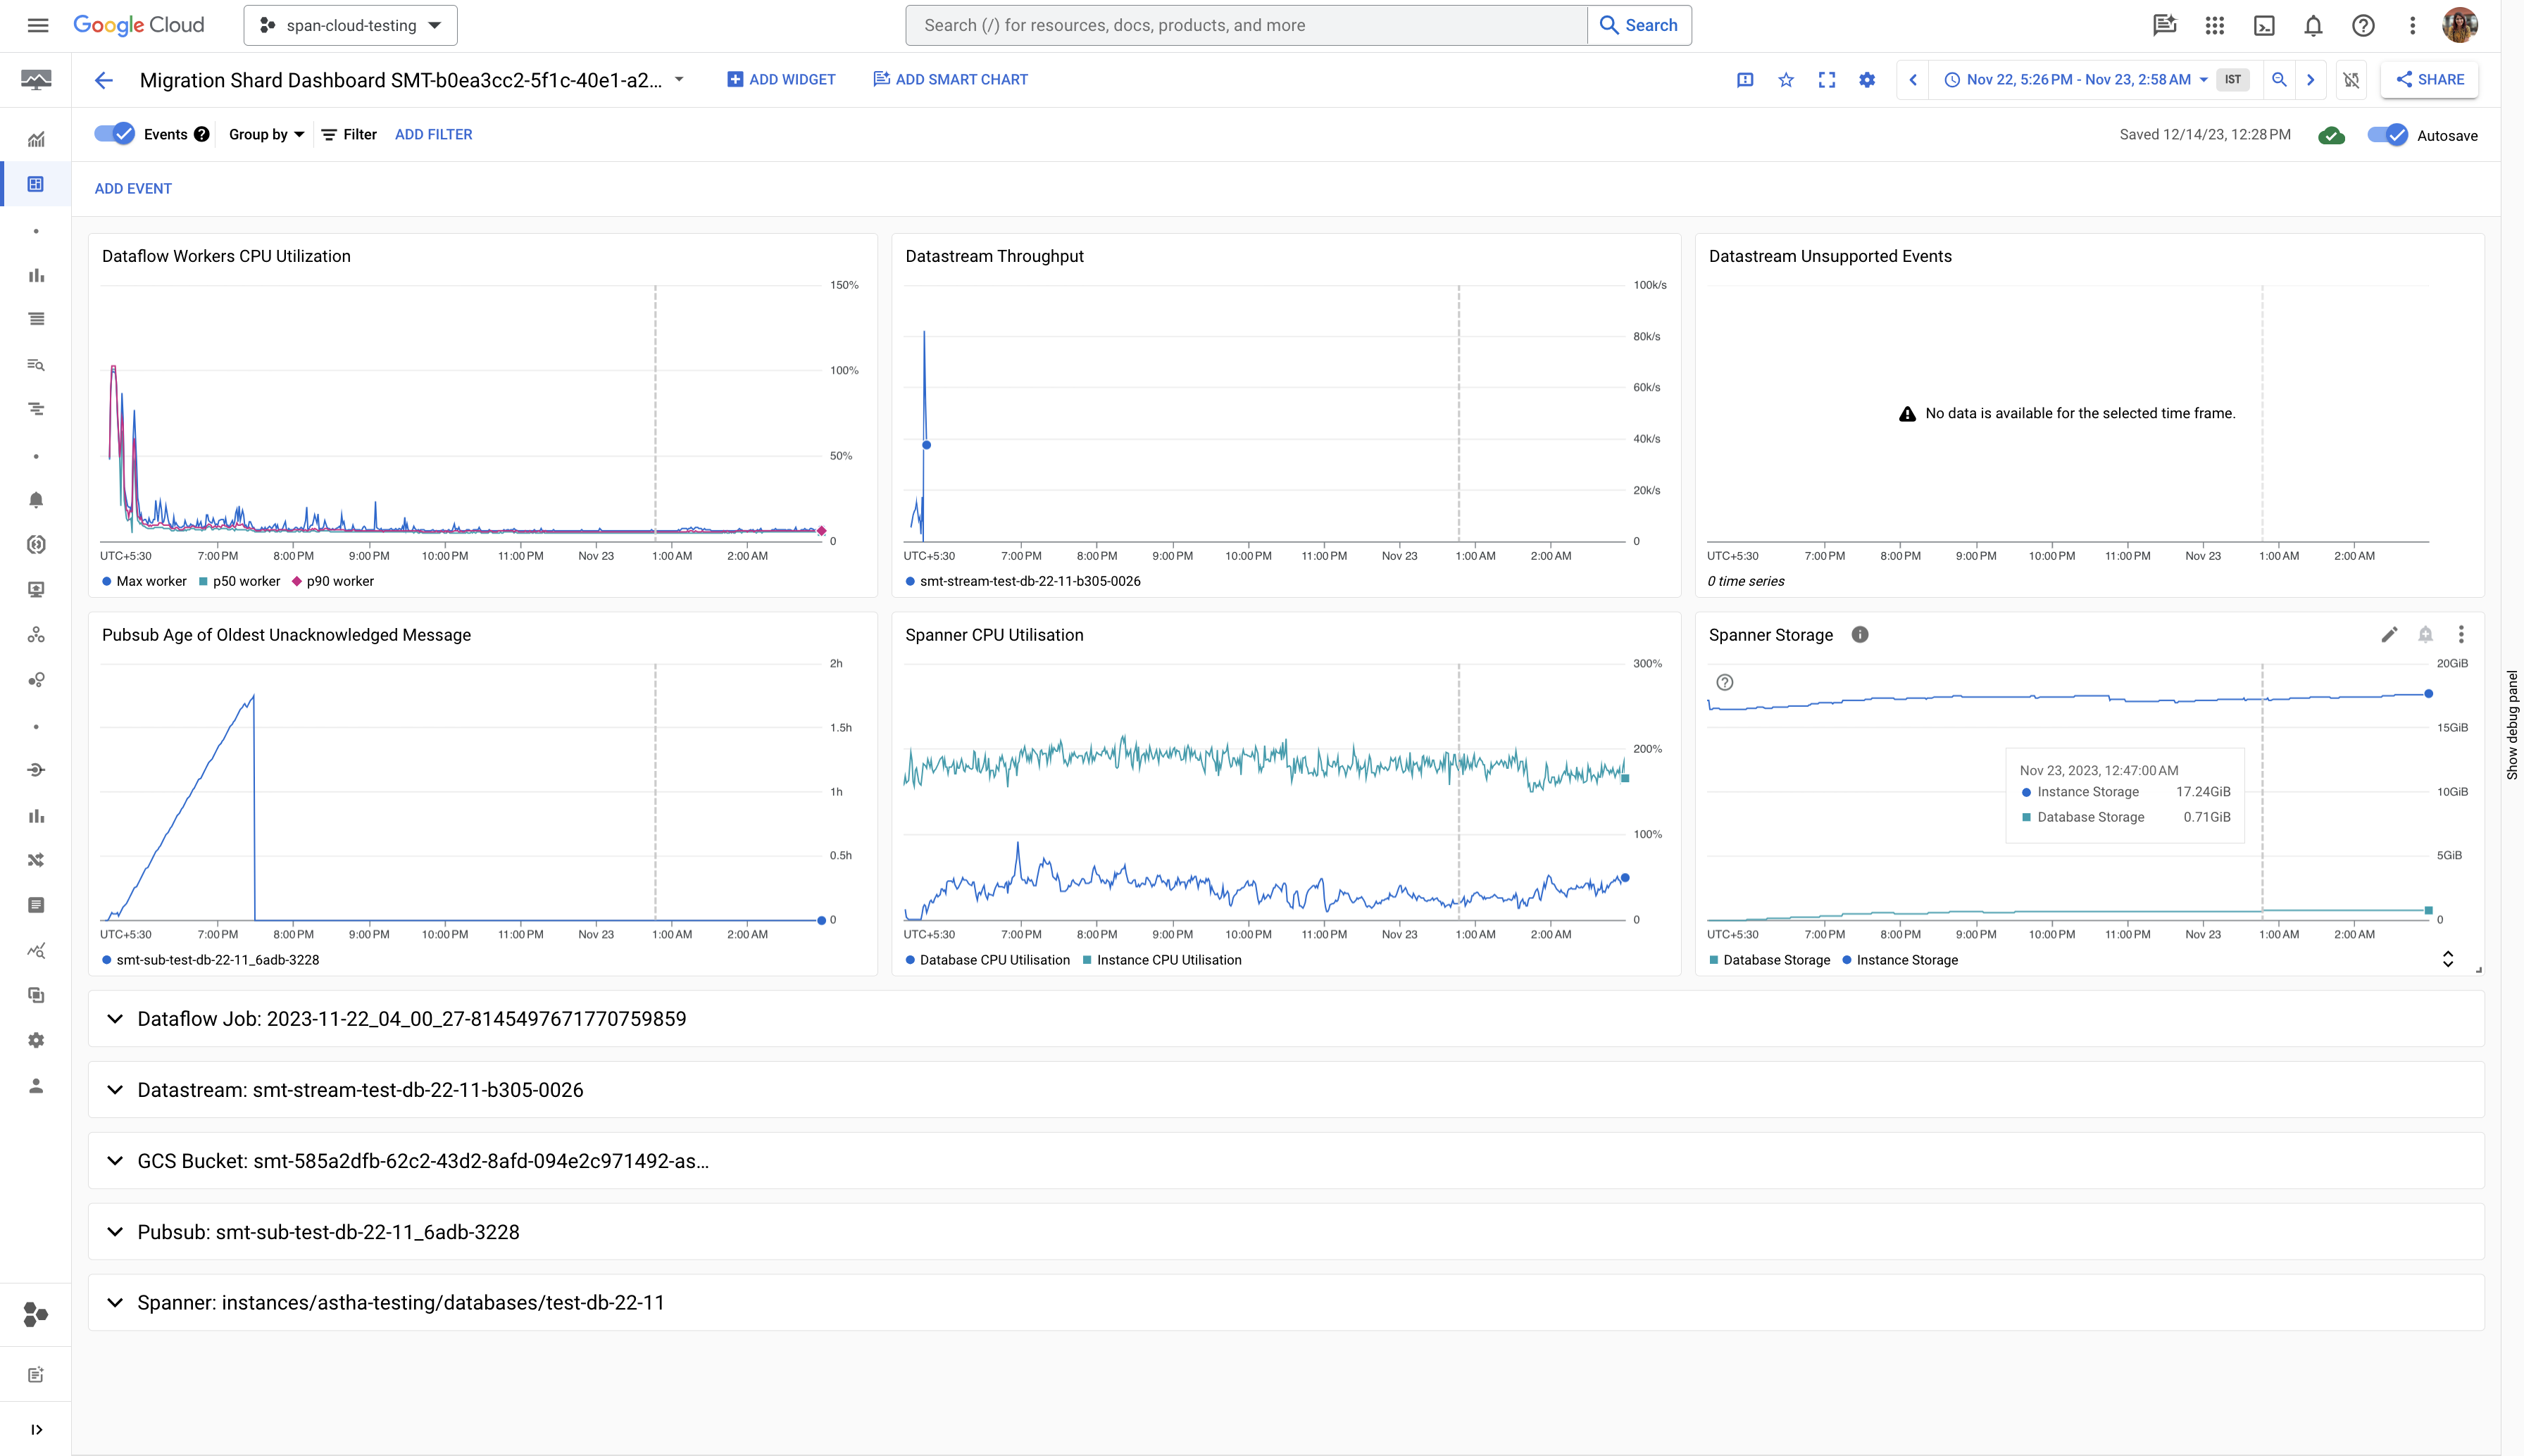
Overview
The first section of the monitoring dashboard provides key graphs for insights on the migration progress.
| Resource | Metric | Description | Aggregation | Relevance |
|---|---|---|---|---|
| Dataflow | Worker CPU Utilization | Shows the CPU Utilization of a dataflow worker | - 50th percentile worker CPU Utilization - 90th percentile worker CPU Utilization - Max percentile worker CPU Utilization | Used to identify if the pipelines is over or under scaled based on the value of CPU Utilization |
| Datastream | Throughput(events/sec) | Shows the average events processed/sec generated at source | Average | Used to track if data is being transferred from source to GCS Bucket |
| Datastream | Unsupported Events | Source events unsupported by Datastream | Sum | Used to identify if there is any data that can’t be transferred by datastream due to a correctness issue |
| Pubsub | Age of Oldest Unacknowledged Message | Age of the oldest unacknowledged message in the subscription | Max | Used to determine if starvation of dataflow resources is taking place |
| Spanner | CPU Utilization | CPU Utilization of spanner database and instance | - Database Total CPU Utilization - Instance Total CPU Utilization | Used to track if spanner is overloaded and requires more or less nodes |
| Spanner | Storage | Storage of spanner database and instance | - Database Total Storage - Instance Total Storage | Used to track how the data is growing as the migration proceeds |
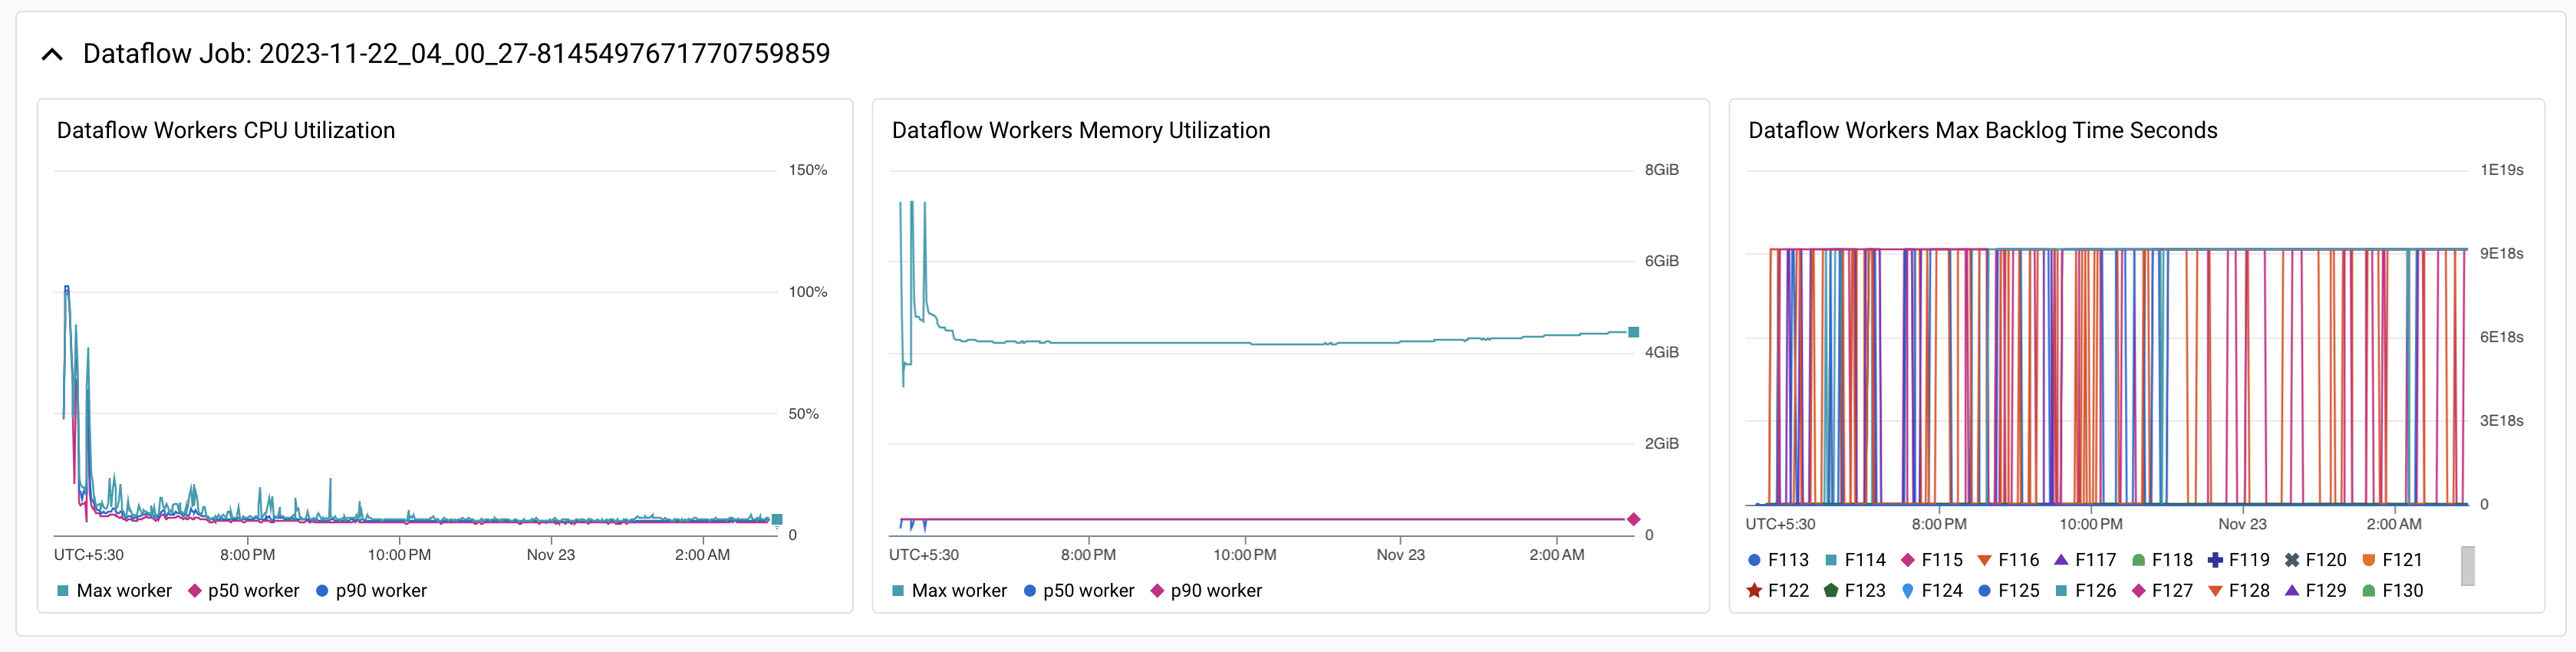
Dataflow Metrics
| Metric | Description | Aggregation | Relevance |
|---|---|---|---|
| Worker CPU Utilization | Shows the CPU Utilization of a dataflow worker | - 50th percentile worker CPU Utilization - 90th percentile worker CPU Utilization - Max percentile worker CPU Utilization | Used to identify if the pipelines is over or under scaled based on the value of CPU Utilization |
| Worker Memory Utilization | Shows the Memory Utilization of a dataflow worker | - 50th percentile worker Memory Utilization - 90th percentile worker Memory Utilization - Max percentile worker Memory Utilization | Used to identify if the health of the pipeline based on the value of Memory Utilization |
| Worker Max Backlog Seconds | Shows max time required to consume the largest backlog across all stages for each dataflow worker | Max | Used to identify if the pipelines is over or under scaled |
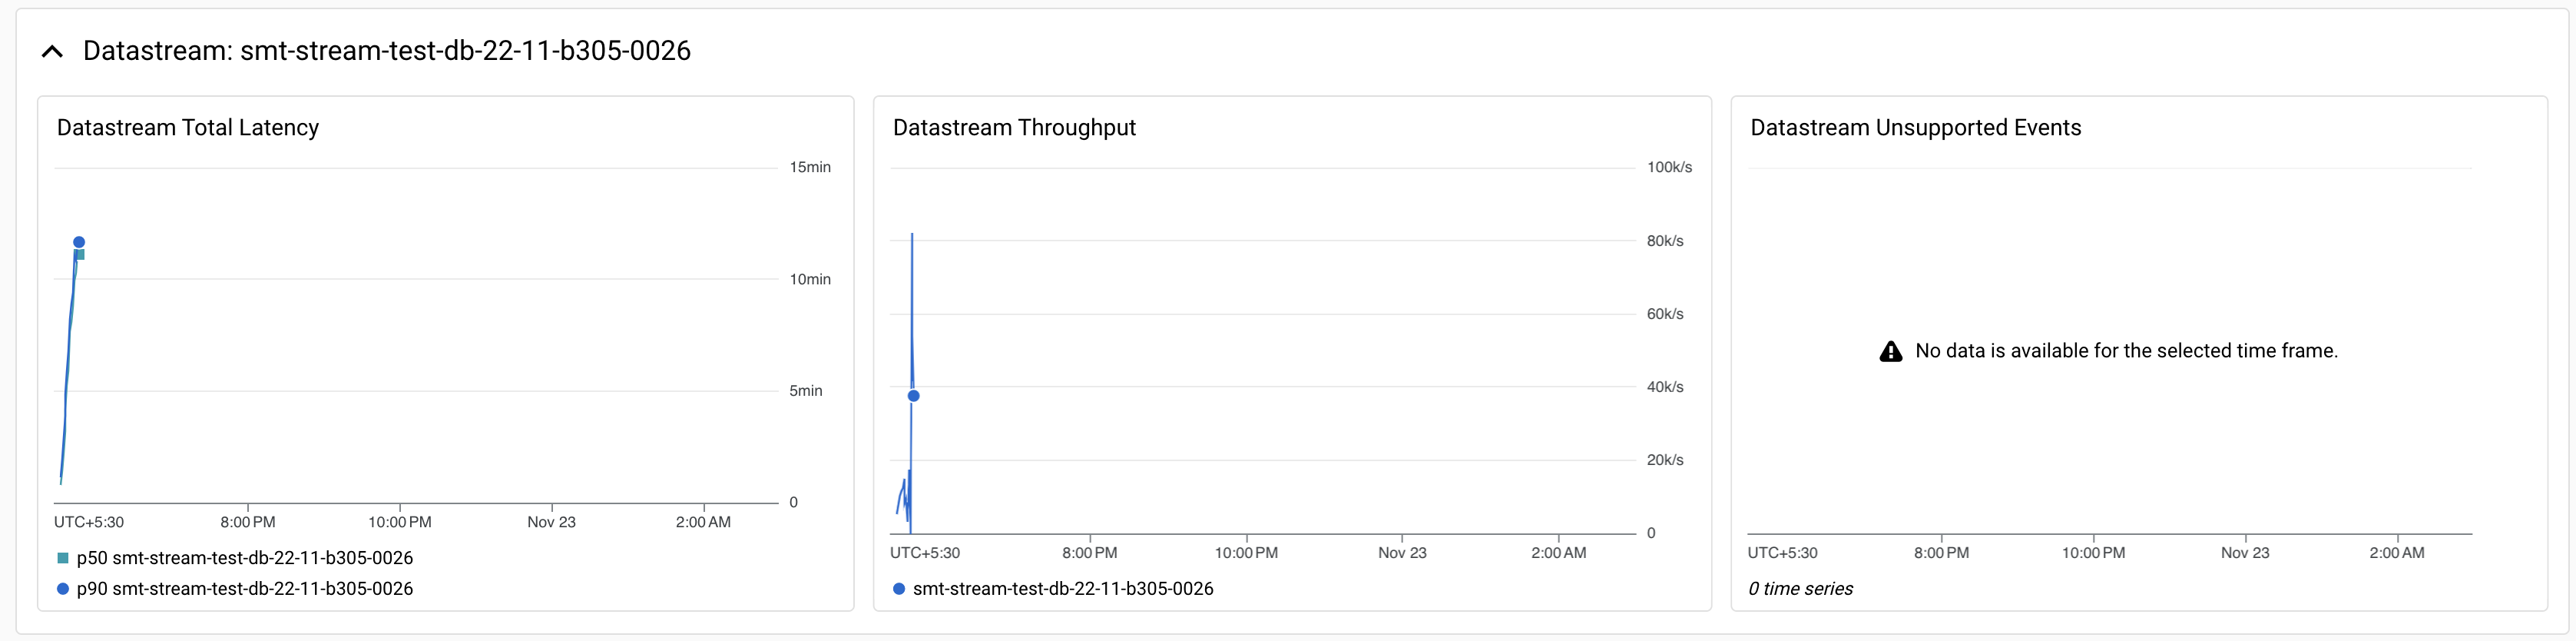
Datastream Metrics
| Metric | Description | Aggregation | Relevance |
|---|---|---|---|
| Throughput(events/sec) | Shows the average events processed/sec generated at source | Sum | Used to track if data is being transferred from source to GCS Bucket |
| Unsupported Events | Source events unsupported by Datastream | Sum | Used to identify if there is any data that can’t be transferred by datastream due to a correctness issue |
| Total Latency | Time taken from event being written at source to being written by Datastream to GCS | - 50th Percentile event - 90th Percentile event | Indicator of datastream being overloaded |
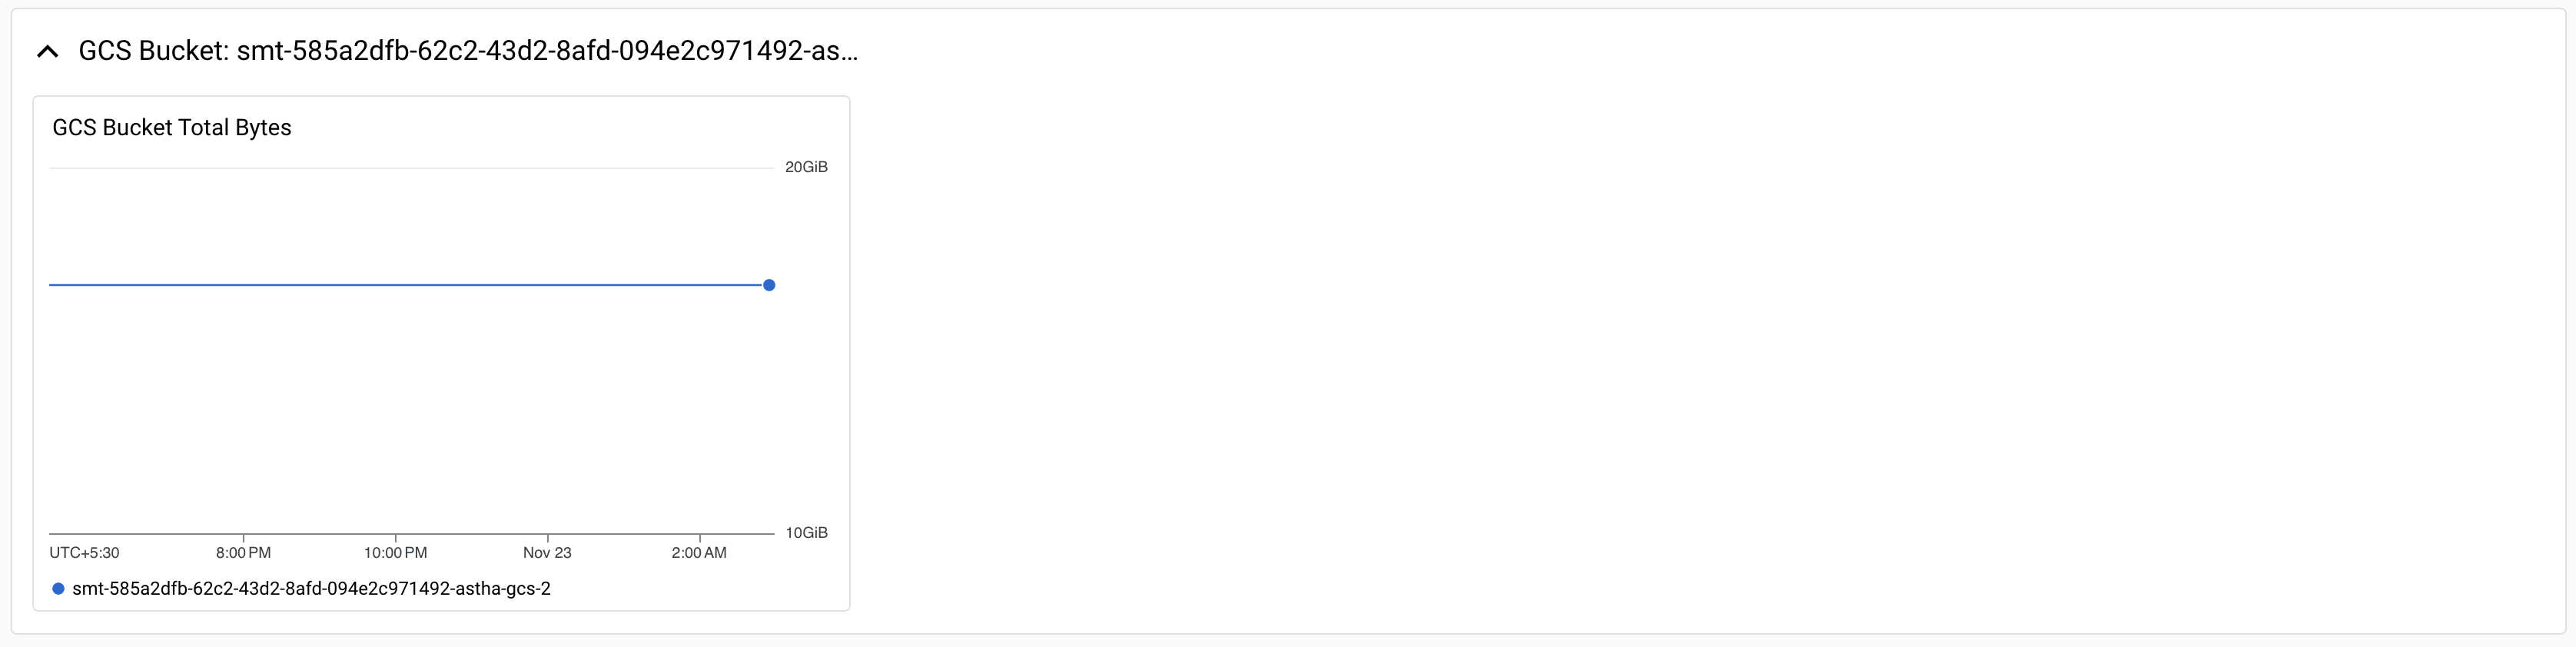
GCS Bucket Metrics
| Metric | Description | Aggregation | Relevance |
|---|---|---|---|
| Total Bytes | Shows the total bytes written to the GCS Bucket | Sum | Used to check if data is successfully being written to the GCS Bucket |
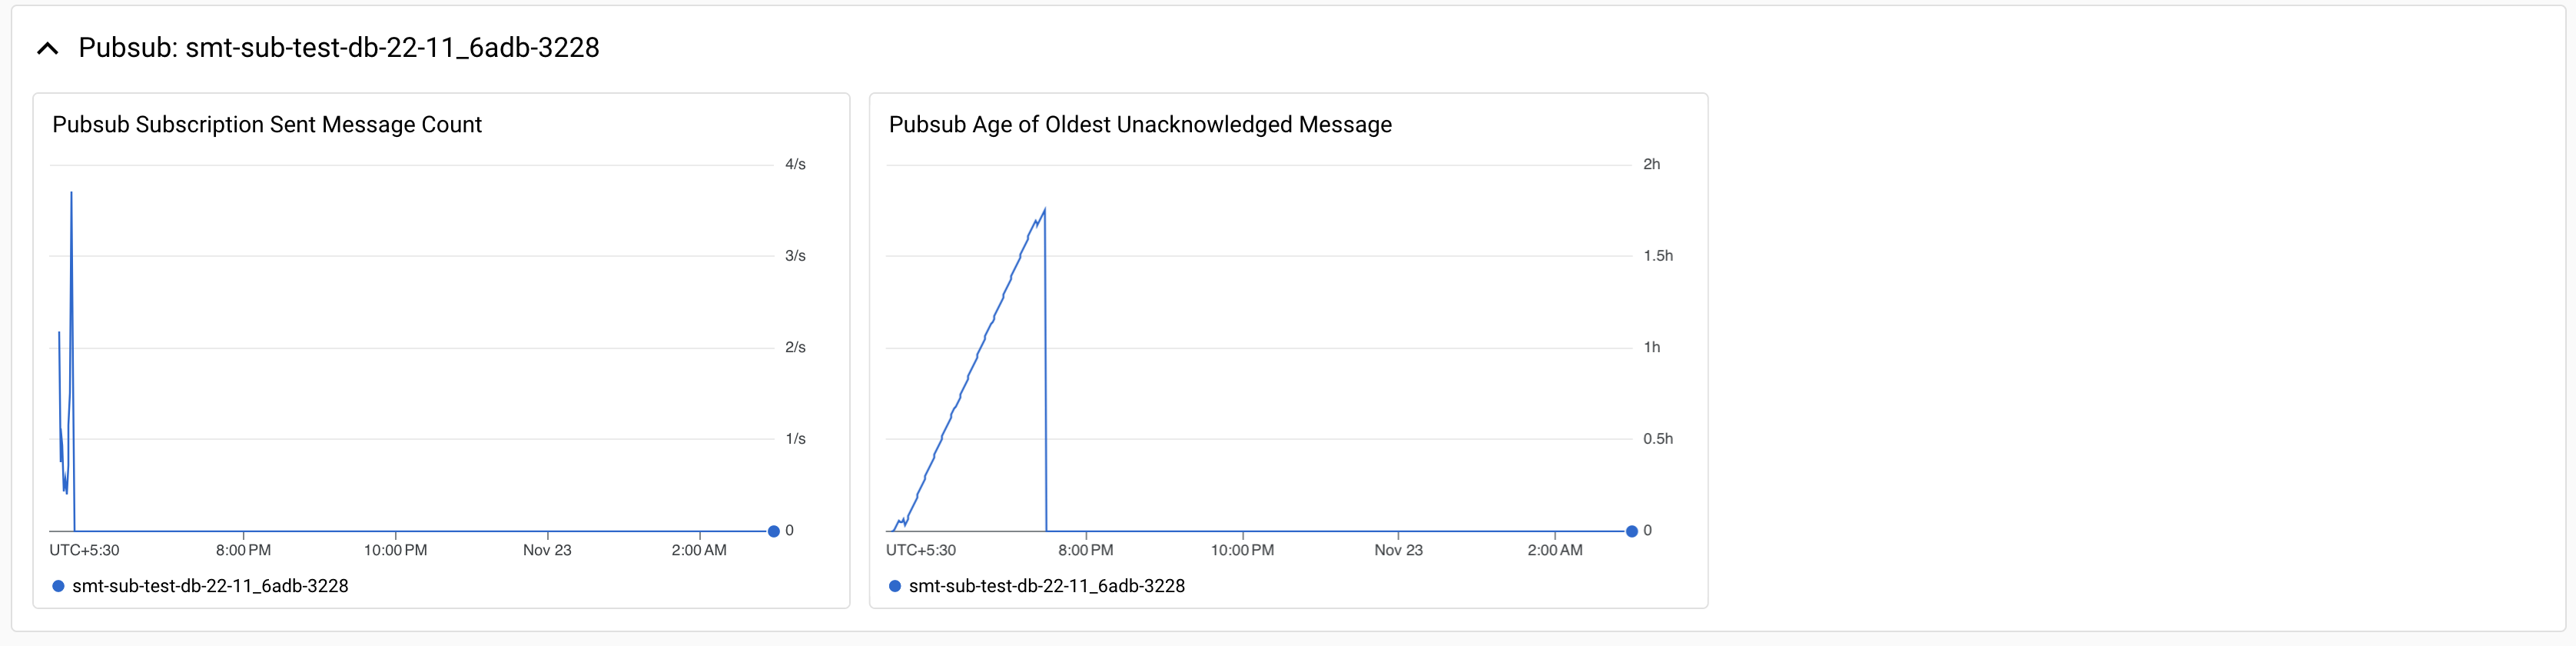
Pubsub Metrics
| Metric | Description | Aggregation | Relevance |
|---|---|---|---|
| Published message count | Number of messages published by the GCS bucket to the Pub | Sum | Indicates total files in staging which need to be processed |
| Age of Oldest Unacknowledged Message | Age of the oldest unacknowledged message in the subscription | Max | Used to determine if starvation of dataflow resources is taking place |
Spanner Metrics
| Metric | Description | Aggregation | Relevance |
|---|---|---|---|
| CPU Utilization | CPU Utilization of spanner database and instance | - Database Total CPU Utilization - Instance Total CPU Utilization | Used to track if spanner is overloaded and requires more or less nodes |
| Storage | Storage of spanner database and instance | - Database Total Storage - Instance Total Storage | Used to track how the data is growing as the migration proceeds |
