Sharded Migration Monitoring Dashboard
For a Sharded Migration a Monitoring Dashboard will be created for each shard and an Aggregated Dashboard will be created for the migration.
Table of contents
Where is my Dashboard?
On the UI, the Migration Dashboards can be found under the Monitoring Dashboards section on the Prepare Migration page after all the resources have been generated. Along with this a list with shards and their corresponding dashboards can be found on the Aggregated Monitoring Dashboard itself as described here. If the dashboard is not visible please check the terminal for any errors in dashboard creation and make sure the correct permissions are provided.
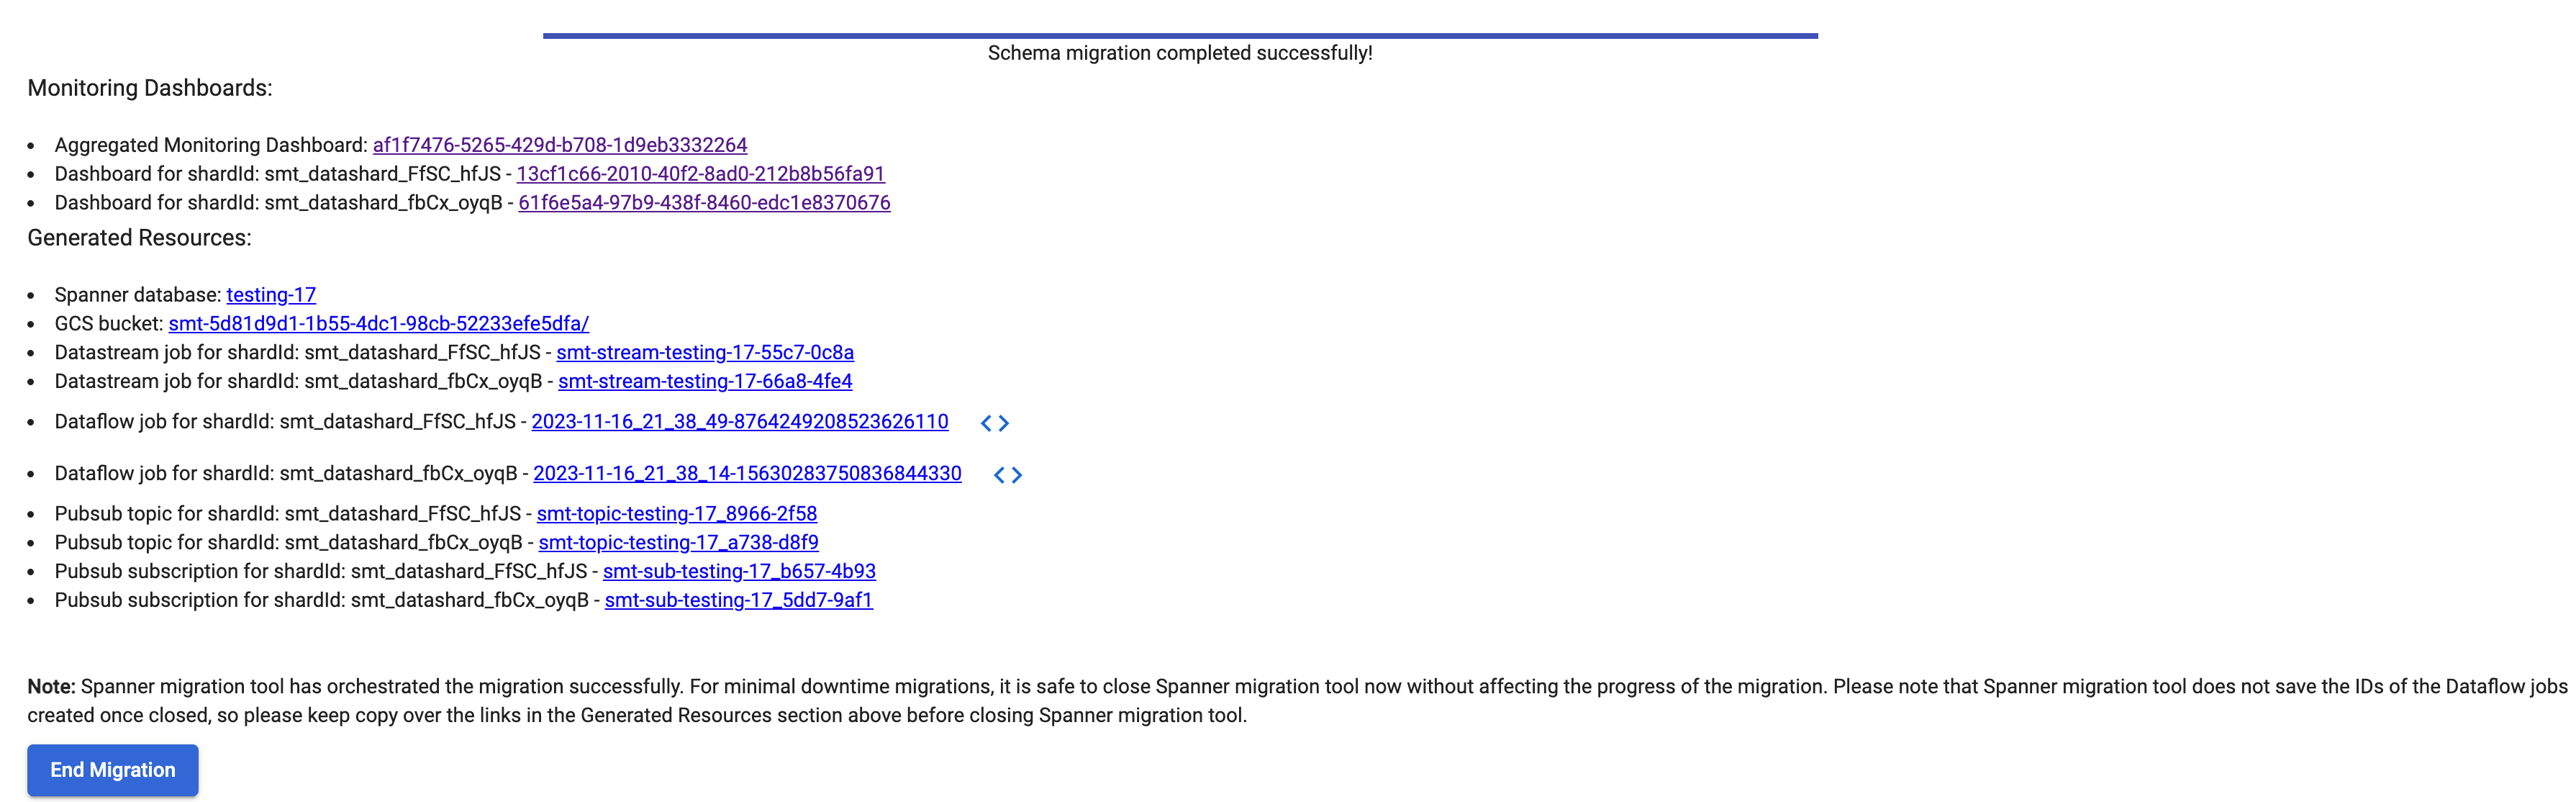
On the CLI, the unique name for each dashboard along with the shard id will be printed on the console. These dashboards can be accessed through cloud monitoring custom dashboards page. Aggregated Monitoring Dashboard name will also be provided.
Components in Monitoring Dashboard
The details corresponding to metrics for each shard in the migration can be found on the Monitoring Migration Dashboard page
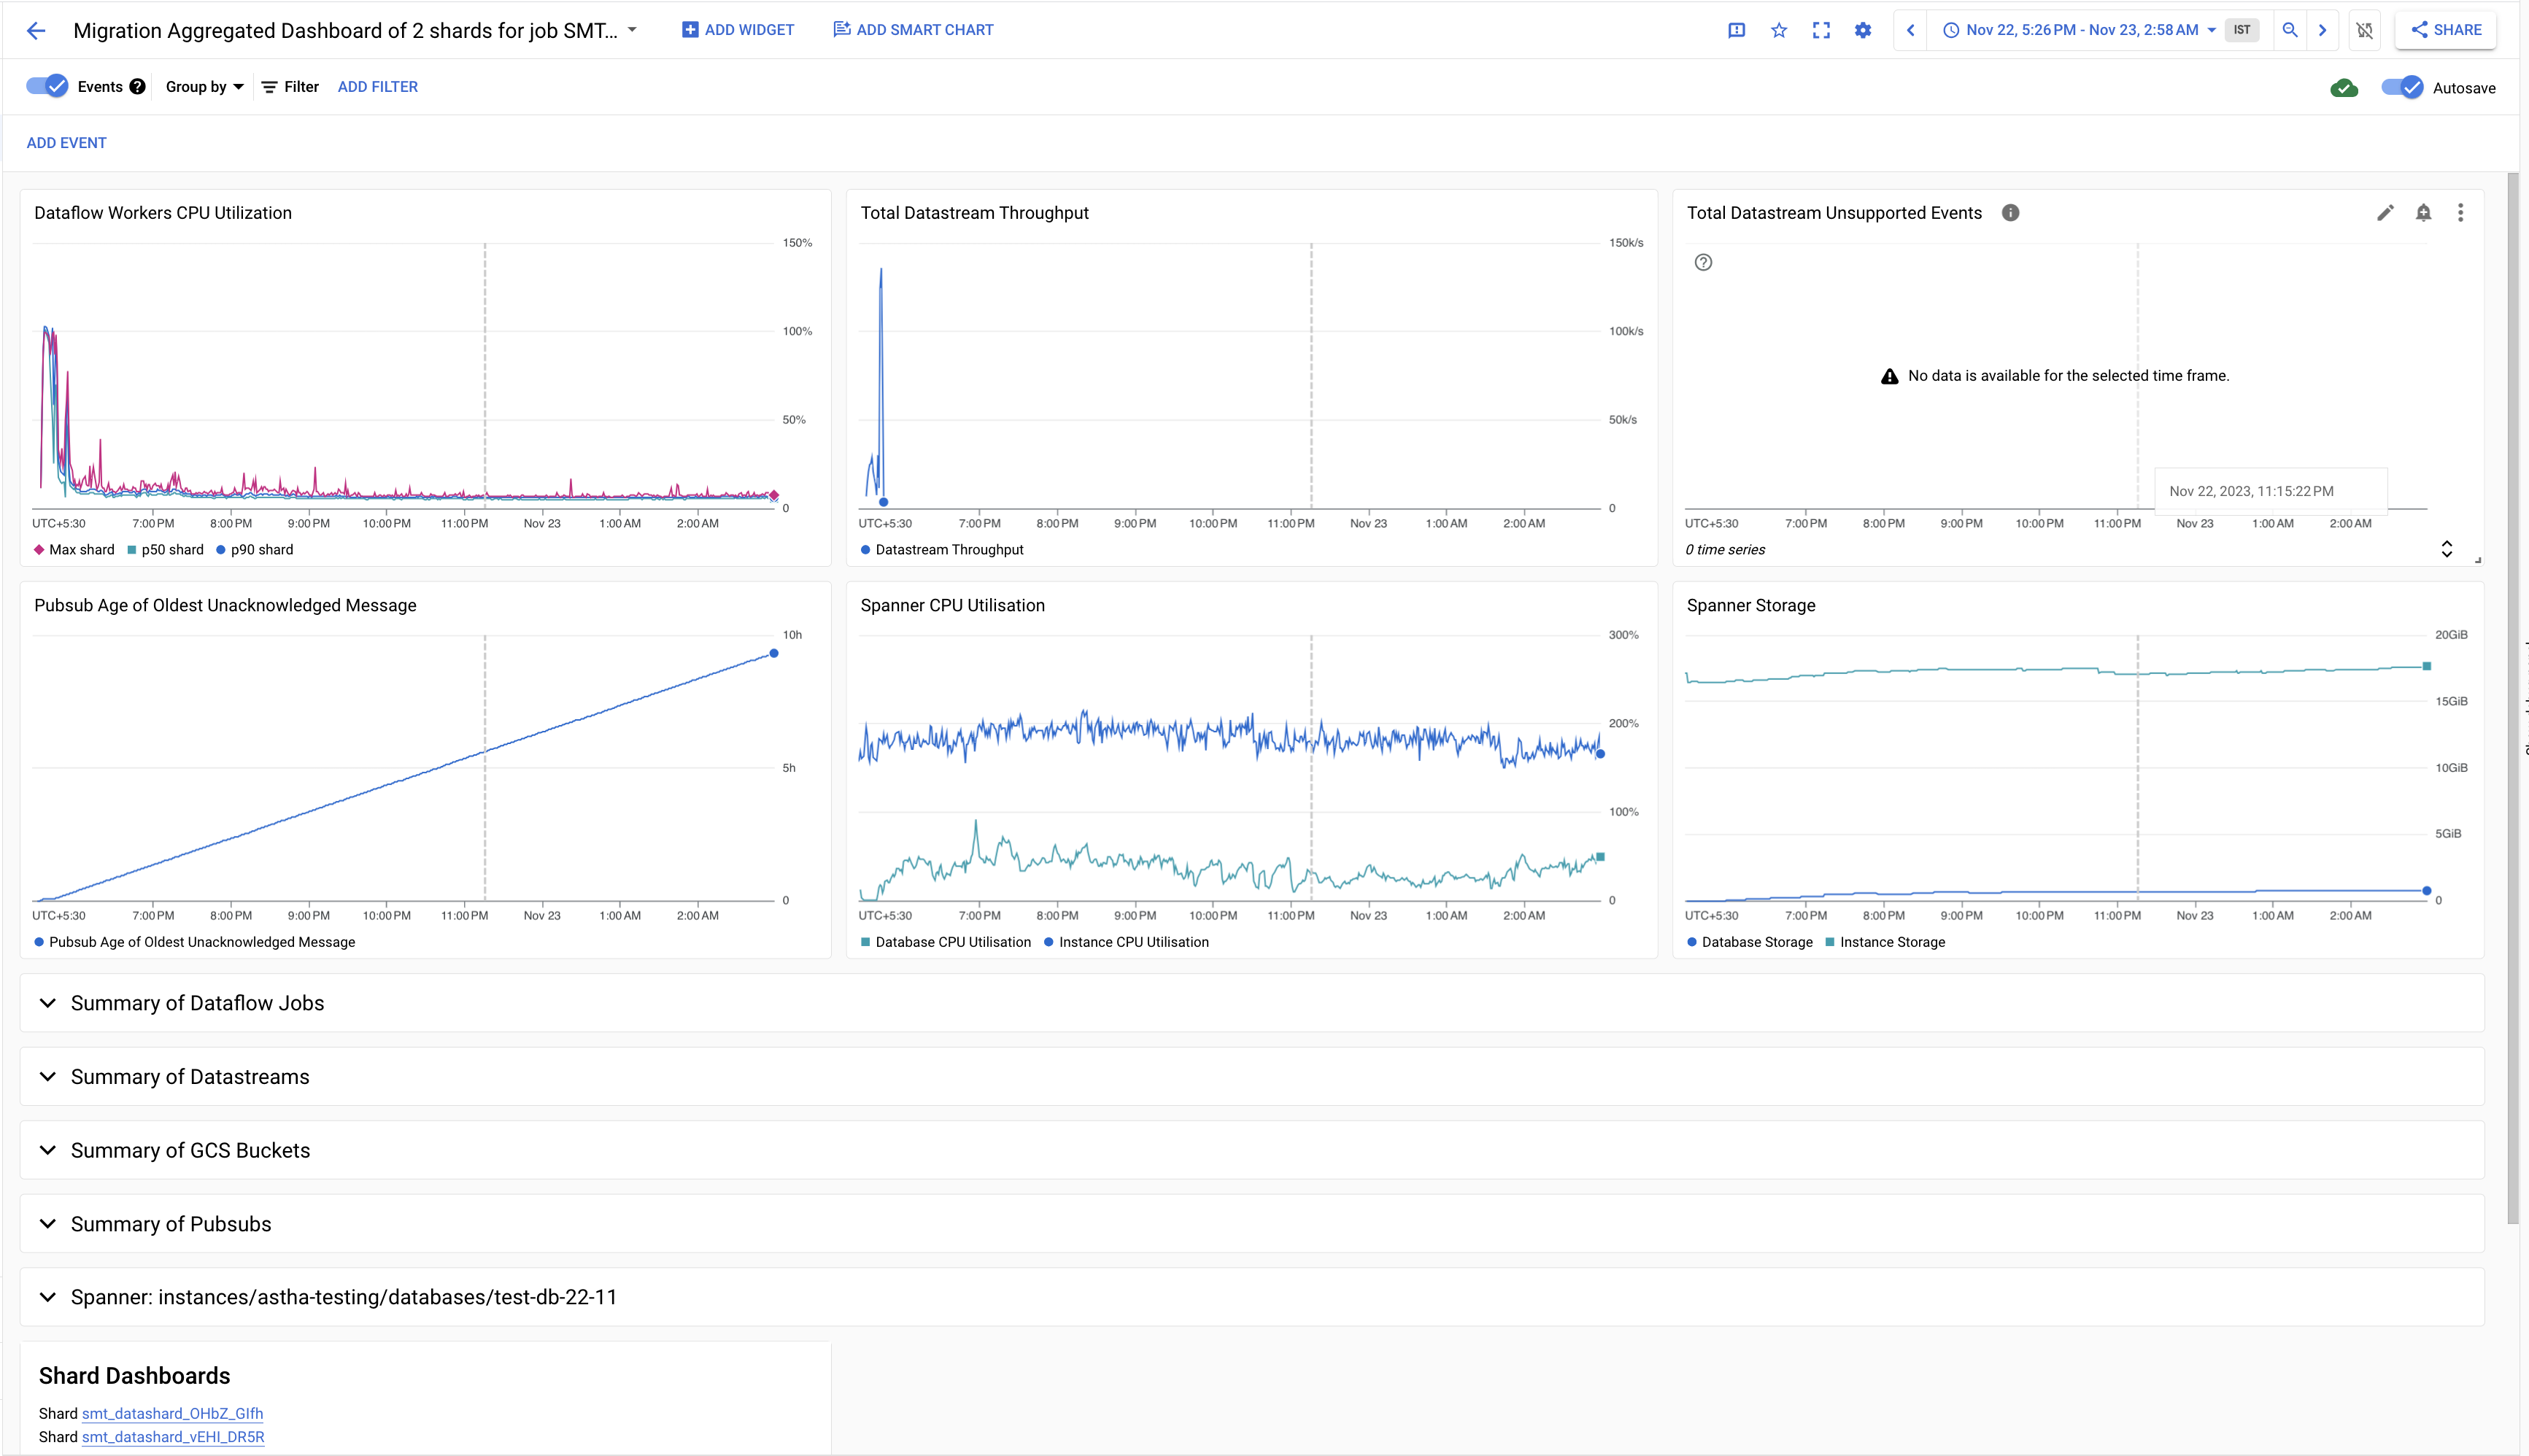
Overview
The first section of the monitoring dashboard provides key graphs for insights on the migration progress.
| Resource | Metric | Description | Aggregation | Relevance |
|---|---|---|---|---|
| Dataflow | Worker CPU Utilization | Shows the CPU Utilization of a dataflow for a shard | - 50th percentile shard CPU Utilization - 90th percentile shard CPU Utilization - Max percentile shard CPU Utilization | Used to identify if for any shards the pipelines is over or under scaled based on the value of CPU Utilization |
| Datastream | Throughput(events/sec) | Shows the total of average events processed/sec by each shard which are generated at source | Total of Average for each shard | Used to track if data is being transferred from source to GCS Bucket |
| Datastream | Unsupported Events | Source events unsupported by Datastream | Sum | Used to identify if there is any data that can’t be transferred by datastream due to a correctness issue |
| Pubsub | Age of Oldest Unacknowledged Message | Age of the oldest unacknowledged message in the subscription | Max | Used to determine if starvation of dataflow resources is taking place |
| Spanner | CPU Utilization | CPU Utilization of spanner database and instance | - Database Total CPU Utilization - Instance Total CPU Utilization | Used to track if spanner is overloaded and requires more or less nodes |
| Spanner | Storage | Storage of spanner database and instance | - Database Total Storage - Instance Total Storage | Used to track how the data is growing as the migration proceeds |
Dataflow Metrics
| Metric | Description | Aggregation | Relevance |
|---|---|---|---|
| Worker CPU Utilization | Shows the CPU Utilization of dataflow for a shard | - 50th percentile shard CPU Utilization - 90th percentile shard CPU Utilization - Max percentile shard CPU Utilization | Used to identify if for any shards the pipelines is over or under scaled based on the value of CPU Utilization |
| Worker Memory Utilization | Shows the Memory Utilization of dataflow for a shard | - 50th percentile shard Memory Utilization - 90th percentile shard Memory Utilization - Max percentile shard v Utilization | Used to identify if the health of the pipeline for any shard based on the value of Memory Utilization |
| Worker Max Backlog Seconds | Shows max time required to consume the largest backlog across all stages for shards | Max | Used to identify if the pipelines is over or under scaled |
| Per Shard Median CPU Utilization | Shows median CPU Utilization for each shard | Total | Used to identify if any shard is struggling and the pipeline for it is under scaled |

Datastream Metrics
| Metric | Description | Aggregation | Relevance |
|---|---|---|---|
| Throughput(events/sec) | Shows the total of average events processed/sec by each shard which are generated at source | Sum | Used to track if data is being transferred from source to GCS Bucket |
| Unsupported Events | Total source events unsupported by Datastream | Sum | Used to identify if there is any data that can’t be transferred by datastream due to a correctness issue |
| Total Latency | Time taken by a event in a shard for being written at source to being written by Datastream to GCS | - 50th Percentile shard - 90th Percentile shard | Indicator of datastream being overloaded |

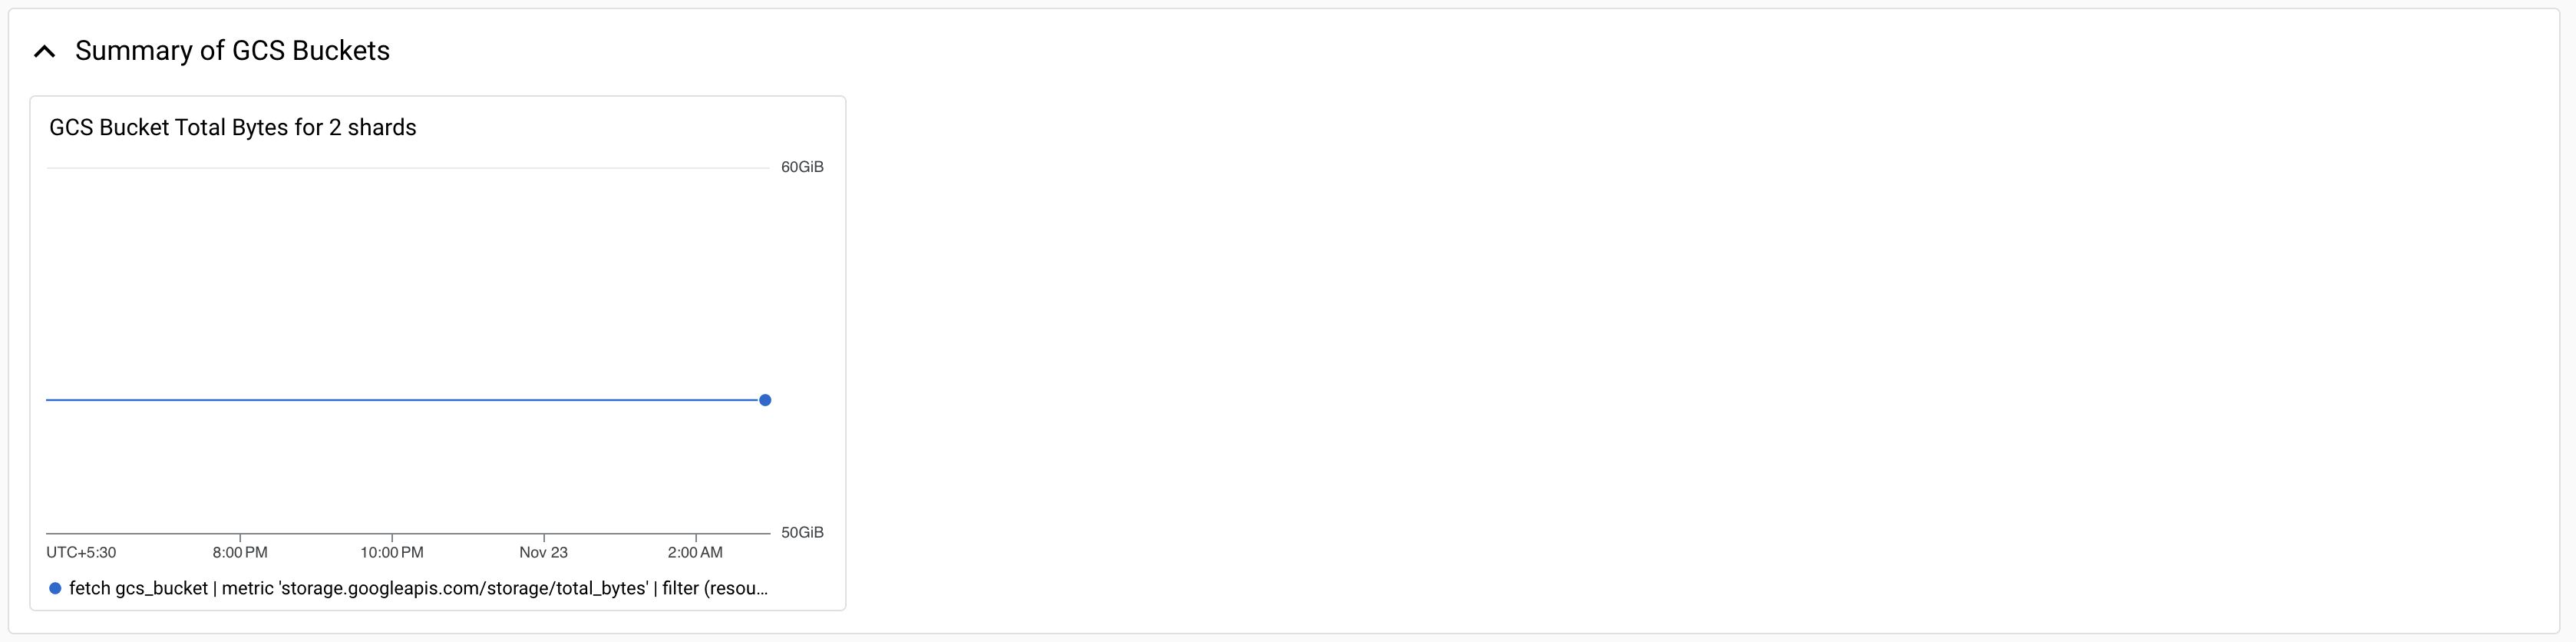
GCS Bucket Metrics
| Metric | Description | Aggregation | Relevance |
|---|---|---|---|
| Total Bytes | Shows the total bytes written to the GCS Buckets of all shards | Sum | Used to check if data is successfully being written to the GCS Bucket |
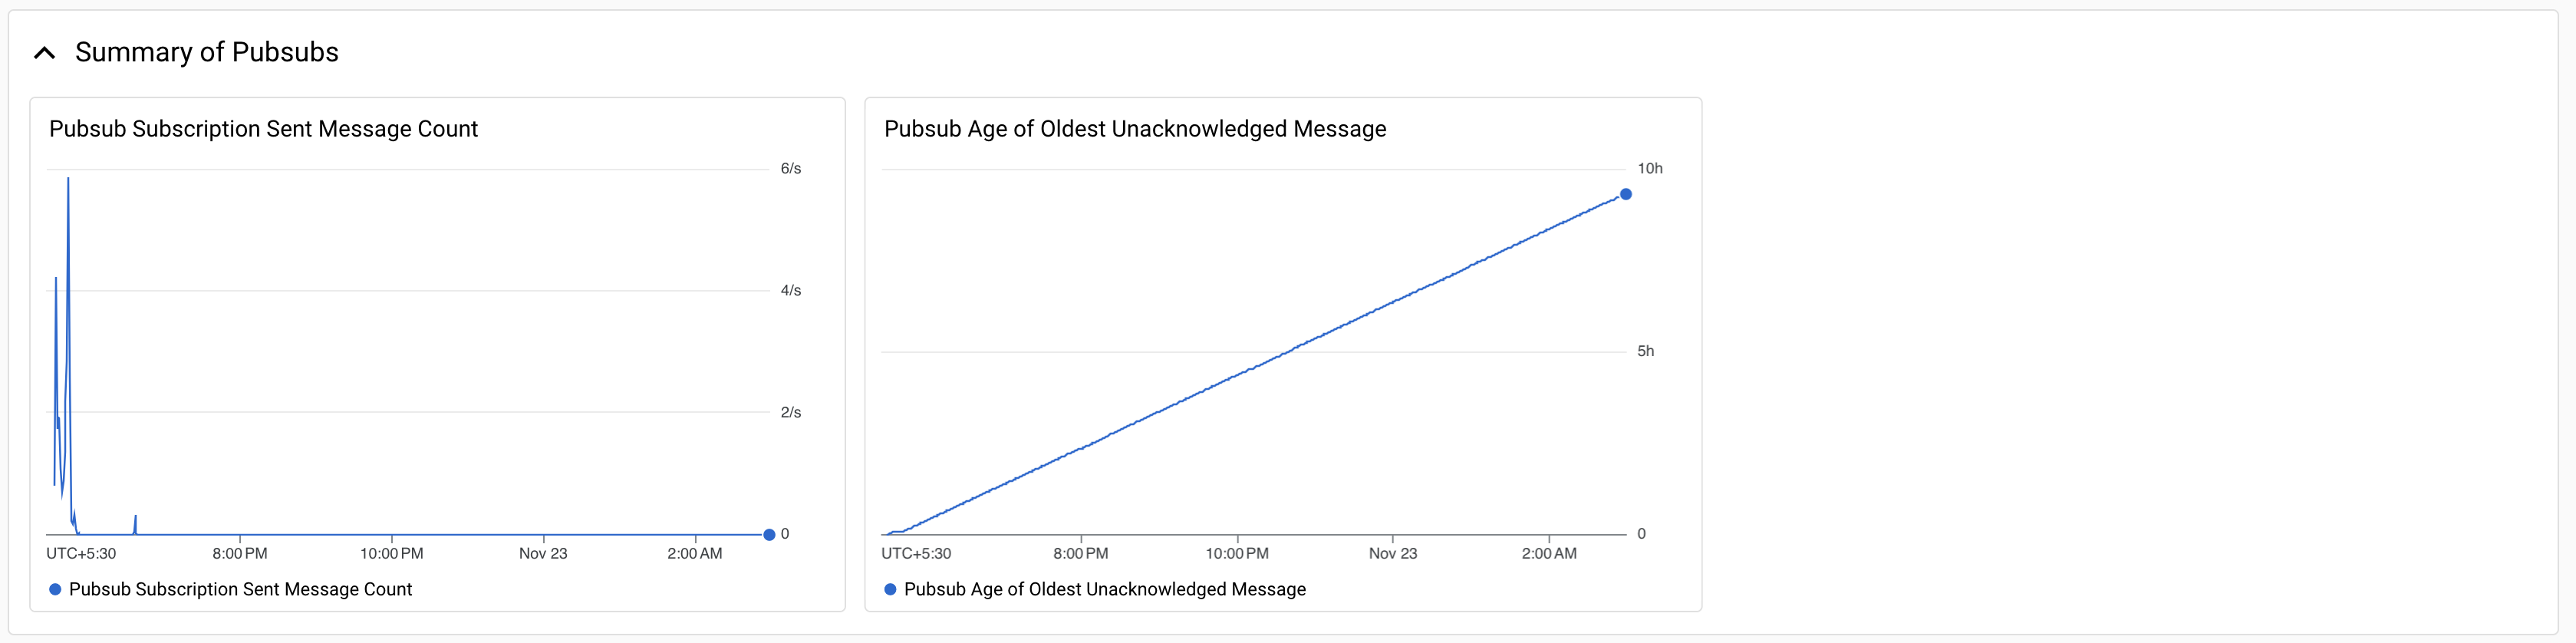
Pubsub Metrics
| Metric | Description | Aggregation | Relevance |
|---|---|---|---|
| Published message count | Number of messages published by the GCS bucket to the Pub for all shards | Sum | Indicates total files in staging which need to be processed |
| Age of Oldest Unacknowledged Message | Age of the oldest unacknowledged message in the subscription in any shard | Max | Used to determine if starvation of dataflow resources is taking place |
Spanner Metrics
| Metric | Description | Aggregation | Relevance |
|---|---|---|---|
| CPU Utilization | CPU Utilization of spanner database and instance | - Database Total CPU Utilization - Instance Total CPU Utilization | Used to track if spanner is overloaded and requires more or less nodes |
| Storage | Storage of spanner database and instance | - Database Total Storage - Instance Total Storage | Used to track how the data is growing as the migration proceeds |

Shards to Dashboard
At the end of the Aggregated Monitoring dashboard a list of individual monitoring dashboard for each shard in a sharded migration can be found.
