Monitoring and Observability
Overview
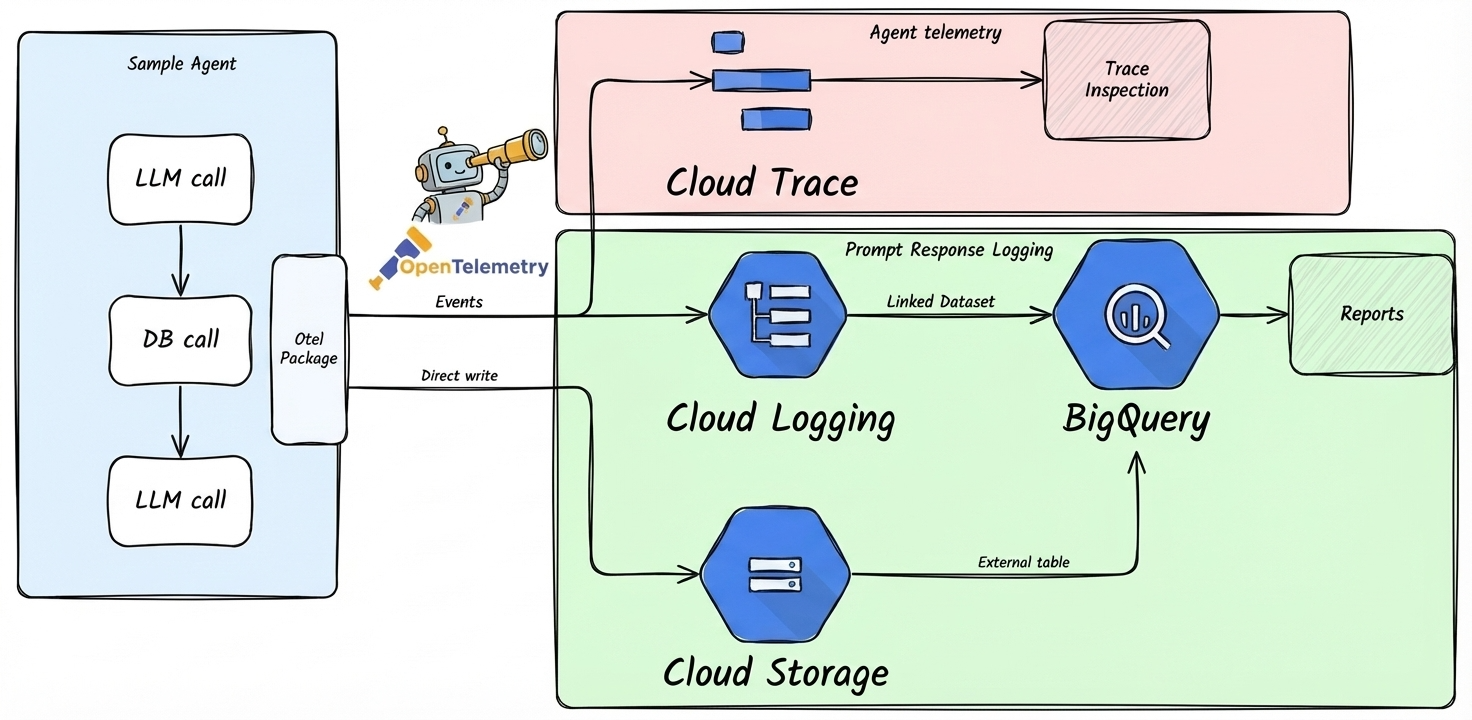
The Agent Starter Pack provides two levels of observability:
Agent Telemetry Events (Always Enabled): OpenTelemetry traces and spans for agent operations, exported to Cloud Trace. This tracks agent execution, latency, and system metrics.
Prompt-Response Logging (Configurable): GenAI instrumentation that captures LLM interactions (prompts, responses, tokens) and exports them to Google Cloud Storage (JSONL), BigQuery (external tables), and Cloud Logging (dedicated bucket). This is disabled by default in local development and enabled by default in deployed environments.
Note for LangGraph users: The LangGraph template only supports agent telemetry events (Cloud Trace). Prompt-response logging is not available due to SDK limitations with streaming responses.
How It Works
Agent Telemetry Events (Always Enabled)
All agent templates automatically export OpenTelemetry traces and spans to Cloud Trace for distributed tracing, request flows, and latency analysis.
This level of telemetry is always active and requires no configuration.
Prompt-Response Logging (Configurable)
For ADK-based agents only, the telemetry setup (app/app_utils/telemetry.py) can be configured to capture:
- GenAI Event Capture: Records model interactions, token usage, and performance metrics
- GCS Upload: Automatically uploads telemetry data to a dedicated GCS bucket in JSONL format
- BigQuery Integration: External tables provide SQL access to telemetry data
- Cloud Logging: Dedicated logging bucket with 10-year retention for GenAI operation logs
- Resource Attribution: Tags events with service namespace and version for filtering
Prompt-response logging is privacy-preserving by default - only metadata (tokens, model name, timing) is logged. Prompts and responses are NOT included (NO_CONTENT mode).
Prompt-Response Logging Behavior by Environment
| Environment | Default State | How It's Configured |
|---|---|---|
Local Development (make playground) | ❌ Disabled | No LOGS_BUCKET_NAME set - see Enabling in Local Dev to enable |
| Dev (Terraform deployed) | ✅ Enabled | Terraform sets LOGS_BUCKET_NAME and OTEL_INSTRUMENTATION_GENAI_CAPTURE_MESSAGE_CONTENT=NO_CONTENT |
| Staging (Terraform deployed) | ✅ Enabled | Terraform sets LOGS_BUCKET_NAME and OTEL_INSTRUMENTATION_GENAI_CAPTURE_MESSAGE_CONTENT=NO_CONTENT |
| Production (Terraform deployed) | ✅ Enabled | Terraform sets LOGS_BUCKET_NAME and OTEL_INSTRUMENTATION_GENAI_CAPTURE_MESSAGE_CONTENT=NO_CONTENT |
Key Points:
- Telemetry is automatically enabled in all Terraform-deployed environments (dev, staging, prod)
- Local development with
make playgroundhas telemetry disabled by default - All environments use privacy-preserving
NO_CONTENTmode - only metadata is captured - For Agent Engine deployments, the platform requires
trueduring deployment, but the app overrides toNO_CONTENTat runtime for privacy
Testing Prompt-Response Logging in Development
After deploying to your development environment, verify that prompt-response logging is working correctly:
1. Deploy and Generate Test Traffic
# Deploy to dev project
gcloud config set project YOUR_DEV_PROJECT_ID
make deploy

# Make a few test requests to your agent
# (use your agent's endpoint - Cloud Run URL or Agent Engine)
2. Verify GCS Upload
Check that telemetry data is being written to GCS:
# Set your project variables
PROJECT_ID="your-dev-project-id"
PROJECT_NAME="your-project-name"

# List telemetry files in GCS
gsutil ls gs://${PROJECT_ID}-${PROJECT_NAME}-logs/completions/

# View a sample telemetry file
gsutil cat gs://${PROJECT_ID}-${PROJECT_NAME}-logs/completions/$(gsutil ls gs://${PROJECT_ID}-${PROJECT_NAME}-logs/completions/ | head -1)
3. Verify Cloud Logging Bucket
Check that the dedicated Cloud Logging bucket was created:
# Describe the telemetry logging bucket
gcloud logging buckets describe ${PROJECT_NAME}-genai-telemetry \
  --location=us-central1 \
  --project=${PROJECT_ID}
4. Query Telemetry in BigQuery
Verify that BigQuery can read the telemetry data:
# Query recent completions
bq query --use_legacy_sql=false \
  "SELECT * FROM \`${PROJECT_ID}.${PROJECT_NAME}_telemetry.completions\` LIMIT 10"

# Query GenAI operation logs from Cloud Logging
bq query --use_legacy_sql=false \
  "SELECT timestamp, jsonPayload FROM \`${PROJECT_ID}.${PROJECT_NAME}_genai_telemetry_logs._AllLogs\` LIMIT 10"
Troubleshooting
If prompt-response logging data is not appearing:
- Check bucket permissions: Ensure the service account has
storage.objectCreatorrole on the logs bucket - Verify environment variables: Check that
LOGS_BUCKET_NAMEis set in your deployment - Check application logs: Look for telemetry setup warnings in Cloud Logging
- Confirm BigQuery tables exist: Run
bq ls ${PROJECT_NAME}_telemetryto list tables
Storage Architecture
Telemetry data is stored in the existing logs bucket:
- Bucket:
{project_id}-{project_name}-logs - Path:
gs://{bucket}/genai-telemetry/ - Format: Newline-delimited JSON (JSONL) for efficient querying
The telemetry setup gracefully handles permission errors - if bucket creation fails, the application continues without blocking, logging a warning instead.
Querying Telemetry Data
Telemetry data is accessible through BigQuery, configured via Terraform in deployment/terraform/bigquery_external.tf:
Telemetry View:
{project_name}_telemetry.genai_telemetry- Flattened view with extracted JSON fields for easier querying
- Built on top of external table that reads GCS directly
- No data duplication - queries GCS in real-time
- Pre-extracted fields:
service_namespace,model,input_tokens,output_tokens, etc.
Raw External Table:
{project_name}_telemetry.genai_telemetry_raw- Direct access to raw JSONL data
- Use this for custom queries or schema exploration
Feedback Data: Feedback logs can be queried from
_AllLogsin Cloud Logging- Filter:
jsonPayload.log_type="feedback"
- Filter:
Example Queries
Query recent telemetry events:
SELECT
  timestamp,
  service_namespace,
  service_version,
  model,
  operation_name,
  input_tokens,
  output_tokens
FROM `{project_id}.{project_name}_telemetry.genai_telemetry`
WHERE timestamp > TIMESTAMP_SUB(CURRENT_TIMESTAMP(), INTERVAL 1 HOUR)
ORDER BY timestamp DESC
LIMIT 100;
Analyze token usage by model:
SELECT
  model,
  service_namespace,
  COUNT(*) as request_count,
  SUM(input_tokens) as total_input_tokens,
  SUM(output_tokens) as total_output_tokens,
  AVG(input_tokens) as avg_input_tokens,
  AVG(output_tokens) as avg_output_tokens
FROM `{project_id}.{project_name}_telemetry.genai_telemetry`
WHERE timestamp > TIMESTAMP_SUB(CURRENT_TIMESTAMP(), INTERVAL 24 HOUR)
  AND input_tokens IS NOT NULL
GROUP BY model, service_namespace
ORDER BY total_input_tokens DESC;
Track requests by version:
SELECT
  service_version,
  DATE(timestamp) as date,
  COUNT(*) as request_count,
  SUM(input_tokens + output_tokens) as total_tokens
FROM `{project_id}.{project_name}_telemetry.genai_telemetry`
WHERE timestamp > TIMESTAMP_SUB(CURRENT_TIMESTAMP(), INTERVAL 7 DAY)
GROUP BY service_version, date
ORDER BY date DESC, service_version;
Advanced: Custom Visualization
For teams that want visual dashboards, you can connect your BigQuery telemetry data to visualization tools like Looker Studio, Data Studio, or other BI tools that support BigQuery as a data source.
To create a custom dashboard:
- Connect your BI tool to BigQuery
- Point to your project's BigQuery telemetry tables:
{project_id}.{project_name}_telemetry.completions- Message content and token data{project_id}.{project_name}_genai_telemetry_logs._AllLogs- GenAI operation logs
- Build visualizations for key metrics like token usage, request volume, latency, and model performance
Note: For most use cases, querying telemetry data directly in BigQuery (see examples above) provides sufficient analytics capabilities.
Configuration
Prompt-response logging behavior is controlled via environment variables. The sections below explain how to enable prompt-response logging locally and how to disable it in deployed environments.
Note: Agent telemetry events (Cloud Trace, Cloud Logging) are always enabled and do not require configuration.
Enabling Prompt-Response Logging in Local Development
By default, make playground runs without prompt-response logging since no GCS bucket is configured. To enable it during local development (ADK agents only):
Option 1: Set Environment Variables Manually
# Set the GCS bucket (must exist and be accessible)
export LOGS_BUCKET_NAME="gs://your-dev-project-id-your-project-name-logs"

# Enable telemetry with NO_CONTENT mode (metadata only)
export OTEL_INSTRUMENTATION_GENAI_CAPTURE_MESSAGE_CONTENT="NO_CONTENT"

# Run playground
make playground
Option 2: Deploy Directly with Environment Variables
Deploy directly without Terraform by creating a logs bucket and passing environment variables:
# First, create a GCS bucket for logs (if not exists)
PROJECT_ID=$(gcloud config get-value project)
gsutil mb -l us-central1 gs://${PROJECT_ID}-logs 2>/dev/null || true
Then deploy with the telemetry environment variables:
For Agent Engine:
uv run -m app.app_utils.deploy \
    --set-env-vars "LOGS_BUCKET_NAME=${PROJECT_ID}-logs,OTEL_INSTRUMENTATION_GENAI_CAPTURE_MESSAGE_CONTENT=NO_CONTENT"
For Cloud Run:
gcloud run deploy <service-name> --source . \
    --set-env-vars "LOGS_BUCKET_NAME=${PROJECT_ID}-logs,OTEL_INSTRUMENTATION_GENAI_CAPTURE_MESSAGE_CONTENT=NO_CONTENT"
Option 3: Deploy Dev Infrastructure with Terraform
Deploy the dev environment infrastructure, which automatically creates the logs bucket and sets up all required resources:
make setup-dev-envThen run make deploy to deploy to your dev project with telemetry enabled.
Note: Prompt-response logging requires:
- ADK-based agent template (not available for LangGraph)
- A valid GCS bucket (
LOGS_BUCKET_NAME) - Proper permissions for the service account to write to the bucket
OTEL_INSTRUMENTATION_GENAI_CAPTURE_MESSAGE_CONTENTset toNO_CONTENTortrue
Disabling Prompt-Response Logging in Deployed Environments
Prompt-response logging is enabled by default when deployed via Terraform (dev, staging, prod). To disable it:
For Cloud Run Deployments
Update the Terraform configuration to set the environment variable to false:
Edit your deployment's
deployment/terraform/[dev/]service.tf:hclenv { name = "OTEL_INSTRUMENTATION_GENAI_CAPTURE_MESSAGE_CONTENT" value = "false" # Changed from "NO_CONTENT" }Apply the change:
bashcd deployment/terraform terraform apply -var-file=vars/[dev/staging/prod].tfvars
Alternatively, update directly via gcloud (temporary change, reverted on next Terraform apply):
gcloud run services update YOUR_SERVICE_NAME \
  --update-env-vars OTEL_INSTRUMENTATION_GENAI_CAPTURE_MESSAGE_CONTENT=false \
  --region=YOUR_REGION \
  --project=YOUR_PROJECT_ID
For Agent Engine Deployments
Modify the deployment script or environment variables:
Edit
app_utils/deploy.pyto remove or modify the telemetry environment variable:python# Remove or set to "false" env_vars["OTEL_INSTRUMENTATION_GENAI_CAPTURE_MESSAGE_CONTENT"] = "false"Redeploy:
bashmake deploy
Environment Variable Reference
These variables control prompt-response logging only (ADK agents). Agent telemetry events are always enabled.
| Variable | Values | Purpose |
|---|---|---|
LOGS_BUCKET_NAME | GCS bucket path (e.g., gs://project-logs) | Required for prompt-response logging. If not set, logging is disabled. Automatically set by Terraform. |
OTEL_INSTRUMENTATION_GENAI_CAPTURE_MESSAGE_CONTENT | false, NO_CONTENT, true | Controls prompt-response logging state and content capture: • false: Logging disabled• NO_CONTENT: Enabled, metadata only (default)• true: Enabled with full content (not recommended) |
GENAI_TELEMETRY_PATH | Path within bucket (default: completions) | Optional: Override upload path for prompt-response logs |
Automatically Set Variables
The following environment variables are configured automatically by the telemetry setup:
GOOGLE_CLOUD_AGENT_ENGINE_ENABLE_TELEMETRY=trueOTEL_INSTRUMENTATION_GENAI_UPLOAD_FORMAT=jsonlOTEL_INSTRUMENTATION_GENAI_COMPLETION_HOOK=uploadOTEL_SEMCONV_STABILITY_OPT_IN=gen_ai_latest_experimentalOTEL_RESOURCE_ATTRIBUTES=service.namespace={project_name},service.version={commit_sha}OTEL_INSTRUMENTATION_GENAI_UPLOAD_BASE_PATH=gs://{bucket}/{path}
Disclaimer
Note: The templated agents are designed to enable your use-case observability in your Google Cloud Project. Google Cloud does not log, monitor, or otherwise access any data generated from the deployed resources. See the Google Cloud Service Terms for more details.